Here’s the question that almost nobody answers specifically.
“How long does it actually take for a home EV charger to pay for itself?”
The forums give vague answers. The charger manufacturers give optimistic marketing claims. The comparison guides compare purchase prices without accounting for the savings that make the investment worthwhile. And most buyers end up making a decision based on incomplete information — either overspending on features they don’t need or underspending on a setup that costs them more in the long run.
This guide on the EV home charger ROI calculator 2026 when it pays off with rebates included gives you the specific, honest answer — not a generic payback estimate, but a framework for calculating your exact break-even point based on your specific charger, your specific tariff, your specific incentive eligibility, and your specific driving pattern.
We cover US, UK, and major European markets. We include every applicable rebate and grant. We calculate payback periods for dumb chargers, smart chargers with TOU scheduling, smart chargers with solar integration, and load-management chargers that avoid panel upgrades. And we give you the tools to run the calculation yourself for your specific situation.
The ROI Framework — What Goes Into the Calculation
Before running specific numbers, establishing what counts as a cost and what counts as a saving ensures the ROI calculation is complete.
Costs (What You Spend)
Upfront costs:
- Hardware purchase price
- Installation cost (labour, materials, permit)
- Any companion device costs (Emporia Vue energy monitor, Myenergi CT clamp where not included)
- Panel upgrade costs if required
Minus immediate incentives (reducing upfront cost):
- Federal tax credit (US): 30% of hardware + installation, up to $1,000
- State/utility rebates (US): Varies by location ($200-$1,500)
- OZEV grant (UK): £350 for eligible flat owners
- ADVENIR (France): Up to €960 for apartment installations
- SEEH (Netherlands): 30% of installation costs up to €1,500
- Bonus Colonnine (Italy): 80% of purchase + installation up to €1,500
- MOVES III (Spain): Up to €500
- Enova (Norway): Approximately €260
- KfW financing savings (Germany): Interest reduction over loan term
Net upfront cost = Total upfront cost minus all applicable incentives
Ongoing annual costs:
- Electricity consumed for EV charging at your tariff rate
- Maintenance (minimal — typically £30-£75/year)
- Smart charger subscription fees (rare, but some commercial networks charge for home products)
Savings (What You Get Back)
Direct savings from home charging vs alternative:
- Cost difference between home charging and the charging method you’d use without a home charger
Smart feature savings:
- TOU scheduling: Difference between standard rate and off-peak rate × annual kWh
- Solar divert: Solar kWh value × kWh diverted
- Load management: Panel upgrade cost avoided (one-time)
Indirect savings:
- Time saved versus public charging dependency
- Reduced vehicle range anxiety enabling less conservative charging behaviour
- Potential vehicle resale value improvement (home charging is better for battery longevity than frequent DC fast charging)
The ROI Formula
Simple payback period: Net upfront cost ÷ Annual net saving = Years to break even
Net annual saving: (Public charging cost OR electricity at standard rate) – (Home charging electricity cost at optimised rate) – Annual maintenance
ROI percentage at 5 years: (5-year total saving – Net upfront cost) ÷ Net upfront cost × 100
Scenario 1: Budget US Setup — Grizzl-E Classic, No Smart Features, Standard Rate
The Setup
- Charger: Grizzl-E Classic — $229
- Installation: $500 (standard)
- Permit: $100
- Total upfront: $829
- Federal tax credit (30% of $829): $249
- Net upfront cost: $580
The Saving Calculation
Alternative without home charger: Public Level 2 charging at ChargePoint/EVgo destination chargers — average $0.25/kWh
Home charging cost (standard rate $0.16/kWh): $789/year (15,000 miles/year, 4,929 kWh)
Public charging cost equivalent: 4,929 kWh × $0.25 = $1,232/year
Annual saving (home vs public Level 2): $1,232 – $789 = $443/year
Maintenance: $50/year
Net annual saving: $443 – $50 = $393/year
The ROI Calculation
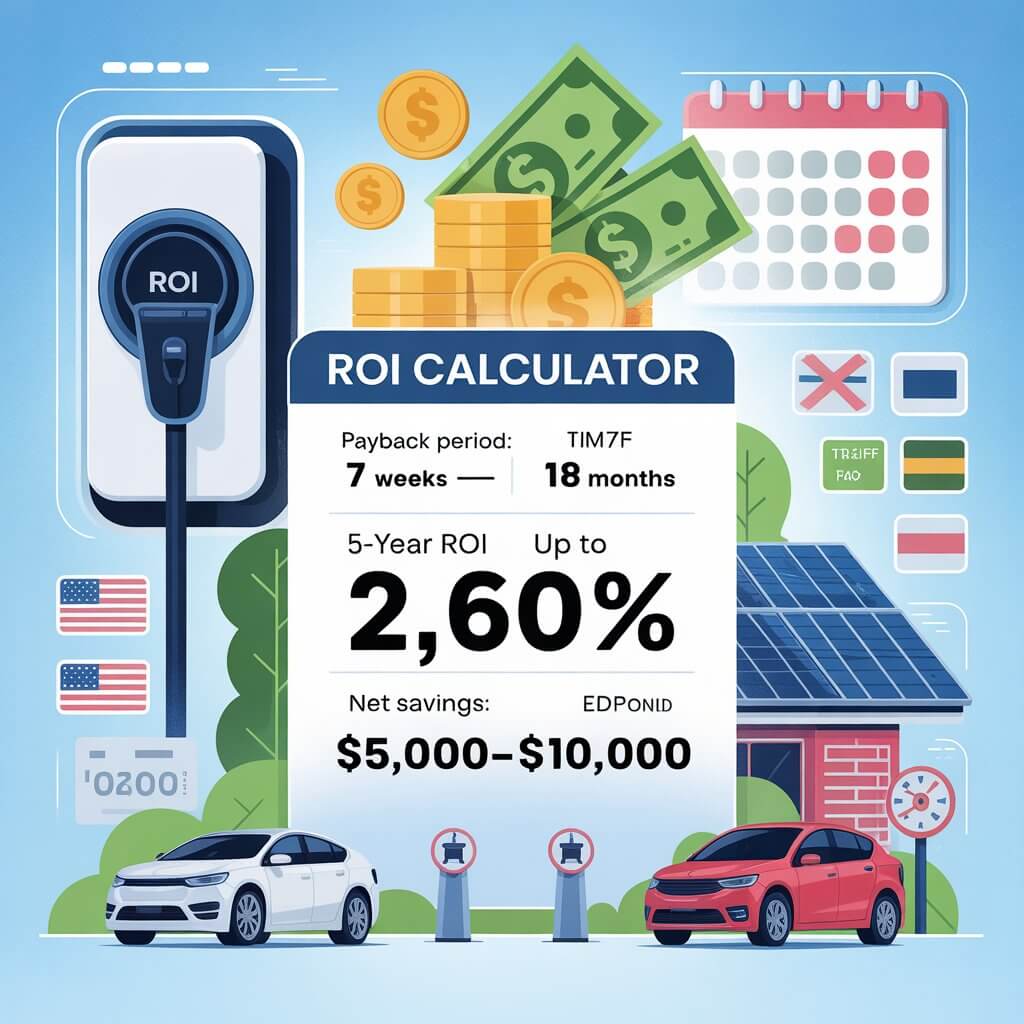
Simple payback period: $580 ÷ $393 = 1.48 years (approximately 18 months)
5-year ROI: 5-year saving: $393 × 5 = $1,965 5-year net return: $1,965 – $580 = $1,385 5-year ROI: $1,385 ÷ $580 × 100 = 239%
The Grizzl-E Classic insight: Even the budget dumb charger pays back in under 18 months versus public Level 2 dependency. The ROI case for ANY home EV charger is strong compared to relying primarily on public Level 2 charging.
Scenario 2: US Smart Charger, TOU Scheduling — ChargePoint Home Flex
The Setup
- Charger: ChargePoint Home Flex — $699
- Installation: $500
- Permit: $100
- Total upfront: $1,299
- Federal tax credit (30% = $390): $390
- Utility rebate (assumed $300, many US utilities): $300
- Net upfront cost: $609
The Saving Calculation
Baseline comparison A — vs public charging ($0.25/kWh):
Home charging with TOU ($0.08/kWh overnight): $394/year
Public charging equivalent: $1,232/year
Annual saving vs public charging: $1,232 – $394 = $838/year
Maintenance: $75/year
Net annual saving vs public: $763/year
Simple payback vs public charging: $609 ÷ $763 = 0.80 years (under 10 months)
Baseline comparison B — vs home charging at standard rate:
Standard rate home charging: $789/year TOU home charging: $394/year Annual TOU saving vs standard rate home: $395/year
Net annual saving vs standard rate home: $395 – $75 = $320/year
Simple payback vs standard rate home charger: Additional cost of ChargePoint vs Grizzl-E Classic after incentives: $609 – $580 = $29 Additional annual saving from TOU: $320 Payback of the smart charger premium: $29 ÷ $320 = 1.1 months (virtually immediate)
5-year ROI (vs public charging): 5-year saving: $763 × 5 = $3,815 5-year net return: $3,815 – $609 = $3,206 5-year ROI: 527%
The ChargePoint Home Flex insight: The combination of TOU scheduling and utility rebates means the smart charger pays back faster than the budget dumb charger compared to public charging dependency — because TOU scheduling dramatically reduces the ongoing electricity cost.
Scenario 3: US Smart Charger + Solar — Emporia Pro, California
The Setup
- Charger: Emporia Pro (NACS) — $399
- Vue energy monitor: $175
- Installation: $500
- Permit: $100
- Total upfront: $1,174
- Federal tax credit (30% = $352): $352
- PG&E utility rebate: $500
- CAEVIP state rebate (if available): $500
- Net upfront cost with all incentives: $1,174 – $1,352 = Net negative — incentives exceed costs
In the best-case California scenario: Net upfront cost = $0 (incentives fully cover costs)
For a more conservative scenario assuming only federal credit + utility rebate ($852 total incentives): Net upfront cost: $1,174 – $852 = $322
The Saving Calculation (Conservative Scenario, $322 Net Cost)
Home charging with TOU ($0.07/kWh PG&E EV2-A) + 30% from solar ($0/kWh):
- 70% from grid: 3,450 kWh × $0.07 = $242/year
- 30% from solar: 1,479 kWh × $0 = $0
- Total: $242/year
Vs public charging ($0.25/kWh): $1,232/year
Annual saving vs public: $1,232 – $242 = $990/year
Maintenance: $75/year
Net annual saving: $915/year
Simple payback: $322 ÷ $915 = 0.35 years (approximately 4 months)
5-year ROI: 5-year saving: $915 × 5 = $4,575 5-year net return: $4,575 – $322 = $4,253 5-year ROI: 1,320%
The Emporia Pro California insight: In the best-case California scenario with all incentives claimed, the charger pays back in weeks — the incentives cover the entire hardware cost. Even in the conservative scenario, payback is under 5 months.
Scenario 4: US Panel Upgrade Avoided — Emporia Pro Load Management
This scenario specifically models the ROI of choosing the Emporia Pro’s load management capability over a panel upgrade — the most financially significant hardware decision for US homeowners on 100-amp panels.
The Two Paths
Path A: Panel upgrade + any 48A charger
- Panel upgrade: $2,500 (median)
- Charger (Grizzl-E Classic): $229
- Installation: $500
- Federal tax credit (30% of $729 = $219): $219
- Net cost: $3,010
Path B: Emporia Pro + Vue (load management)
- Emporia Pro: $399
- Vue monitor: $175
- Installation: $500
- Federal tax credit (30% of $1,074 = $322): $322
- Utility rebate: $300
- Net cost: $452
Cost saving of Path B over Path A: $3,010 – $452 = $2,558 upfront saving
Annual electricity saving (both paths charge at same TOU rate): Identical — both provide 48A charging on TOU
The load management ROI: The Emporia Pro Path B is $2,558 cheaper upfront. With identical ongoing electricity costs, the $2,558 saving is the entire ROI of the load management decision.
ROI on the additional cost of Emporia Pro vs basic charger for load management: Emporia Pro net cost ($452) vs Grizzl-E Classic net cost ($580) — Emporia Pro is actually cheaper after incentives. The load management is effectively free — and saves $2,558 in panel upgrade costs.
The load management insight: For 100-amp panel US homeowners, the Emporia Pro’s load management doesn’t just pay back — it generates positive value from day one by avoiding a panel upgrade that costs $2,000-$4,000 more than the Emporia Pro itself.
Scenario 5: UK Smart Charger — Myenergi Zappi, Octopus Go + Solar
The Setup
- Charger: Myenergi Zappi — £799
- Installation (including CT clamp): £400
- Total upfront: £1,199
- OZEV grant (eligible flat owner): £350
- Net upfront cost: £849
The Saving Calculation
Home charging (Octopus Go 7.5p/kWh + 30% solar):
- 70% Octopus Go: 2,516 kWh × £0.075 = £189/year
- 30% solar: 1,078 kWh × £0 = £0
- Total: £189/year
vs standard rate home charging (28p/kWh):
- Standard rate: 3,594 kWh × £0.28 = £1,006/year
Annual saving vs standard rate home: £1,006 – £189 = £817/year
vs public charging (£0.65/kWh average public AC UK):
- Public charging cost: 3,594 × £0.65 = £2,336/year
- Annual saving vs public: £2,336 – £189 = £2,147/year
Maintenance: £75/year
Net annual saving vs standard rate home: £817 – £75 = £742/year
Net annual saving vs public charging: £2,147 – £75 = £2,072/year
The ROI Calculation
Simple payback vs standard rate home: £849 ÷ £742 = 1.14 years (approximately 14 months)
Simple payback vs public charging: £849 ÷ £2,072 = 0.41 years (approximately 5 months)
5-year ROI vs standard rate home: 5-year saving: £742 × 5 = £3,710 5-year net return: £3,710 – £849 = £2,861 5-year ROI: 337%
5-year ROI vs public charging: 5-year saving: £2,072 × 5 = £10,360 5-year net return: £10,360 – £849 = £9,511 5-year ROI: 1,120%
The Myenergi Zappi UK insight: Against public charging, the Zappi pays back in 5 months and delivers over 1,000% ROI over 5 years. Even against standard rate home charging, payback is under 14 months. This is one of the strongest ROI cases of any home improvement investment available in 2026.
Scenario 6: UK Premium Setup — Andersen A2, Standard Rate, No Solar
The Setup
- Charger: Andersen A2 — £1,499
- Installation: £500
- Total upfront: £1,999
- OZEV grant (eligible): £350
- Net upfront cost: £1,649
The Saving Calculation
Home charging at standard rate (28p/kWh): £1,006/year
vs public charging (£0.65/kWh): £2,336/year
Annual saving vs public: £2,336 – £1,006 = £1,330/year
Maintenance: £100/year
Net annual saving vs public: £1,230/year
Simple payback vs public charging: £1,649 ÷ £1,230 = 1.34 years (approximately 16 months)
vs standard rate dumb charger (Rolec WallPod):
- Rolec net cost: £449 (after OZEV grant)
- Andersen additional cost: £1,649 – £449 = £1,200 more than Rolec
- Same annual electricity cost (no TOU, no solar)
- Payback of Andersen premium over Rolec: Never (identical ongoing savings)
The Andersen A2 honest insight: The Andersen A2 pays back reasonably versus public charging dependency — but it costs £1,200 more than a Rolec WallPod for identical electricity savings when neither has TOU or solar integration. The Andersen premium is a design and aesthetics investment, not an ROI investment.
Scenario 7: European — France, ADVENIR + Solar + Heures Creuses
The Setup
- Charger: Easee One — €549
- Installation: €400
- Total upfront: €949
- ADVENIR subsidy (apartment): €600
- TVA reduction saving: €138 (14.5% on €949)
- Net upfront cost: €211
The Saving Calculation
Home charging (Heures Creuses €0.14/kWh + 25% solar):
- 75% Heures Creuses: 2,352 kWh × €0.14 = €329/year
- 25% solar: 784 kWh × €0 = €0
- Total: €329/year
vs standard rate (€0.23/kWh): 3,136 kWh × €0.23 = €721/year
Annual saving vs standard rate: €721 – €329 = €392/year
Maintenance: €75/year
Net annual saving: €317/year
Simple payback: €211 ÷ €317 = 0.67 years (approximately 8 months)
5-year ROI: 5-year saving: €317 × 5 = €1,585 5-year net return: €1,585 – €211 = €1,374 5-year ROI: 651%
Scenario 8: European — Italy, Bonus Colonnine
The Setup
- Charger: Wallbox Pulsar Plus — €749
- Installation: €400
- Total upfront: €1,149
- Bonus Colonnine (80% up to €1,500): €919
- Net upfront cost: €230
The Saving Calculation
Home charging (Italian off-peak €0.18/kWh): 3,136 kWh × €0.18 = €564/year
vs public charging (€0.60/kWh Italian public average): 3,136 × €0.60 = €1,882/year
Annual saving vs public: €1,882 – €564 = €1,318/year
Maintenance: €75/year
Net annual saving vs public: €1,243/year
Simple payback vs public: €230 ÷ €1,243 = 0.18 years (approximately 7 weeks)
5-year ROI vs public charging: 5-year saving: €1,243 × 5 = €6,215 5-year net return: €6,215 – €230 = €5,985 5-year ROI: 2,602%
The Italy insight: The Bonus Colonnine’s extraordinary generosity (80% of costs) creates the fastest payback of any scenario in this guide — 7 weeks against public charging dependency. Italian EV owners who successfully access an open Bonus Colonnine application window are making the most financially efficient home EV charger investment available in any European market.
The Public Charging Dependency Scenario — What You Pay Without Home Charging
A critical input to any EV home charger ROI calculation is the cost of the alternative — what you’d spend on charging without a home charger. This is the comparison most ROI guides skip.
US Public Charging Costs
Level 2 public AC (ChargePoint, EVgo destination): $0.20-$0.35/kWh DC fast charging (Electrify America, EVgo DC): $0.40-$0.55/kWh Tesla Supercharger (NACS vehicles): $0.25-$0.50/kWh
Annual cost for 15,000 miles/year primarily on public charging:
- Mix of Level 2 ($0.25) and occasional DC fast ($0.45): average $0.30/kWh
- 4,929 kWh × $0.30 = $1,479/year
- 5-year public charging cost: $7,395
UK Public Charging Costs
Pod Point, ChargePoint, BP Pulse (AC): £0.45-£0.80/kWh Osprey, InstaVolt, Gridserve (DC fast): £0.65-£0.90/kWh Ionity (ultra-fast): £0.69-£0.79/kWh
Annual cost for 10,000 miles/year primarily on public charging:
- Mix of AC and occasional DC: average £0.65/kWh
- 3,594 kWh × £0.65 = £2,336/year
- 5-year public charging cost: £11,680
The Home Charging Saving vs Public Charging Over 5 Years
| Setup | 5-Year Home Charging Cost | vs 5-Year Public Cost | 5-Year Saving |
|---|---|---|---|
| US budget (Grizzl-E, standard rate) | $3,945 | $7,395 | $3,450 |
| US smart TOU (ChargePoint) | $1,970 | $7,395 | $5,425 |
| US TOU + solar (Emporia, CA) | $1,210 | $7,395 | $6,185 |
| UK standard rate (Rolec) | £5,030 | £11,680 | £6,650 |
| UK Octopus Go (Wallbox) | £1,349 | £11,680 | £10,331 |
| UK Octopus Go + solar (Zappi) | £943 | £11,680 | £10,737 |
Against public charging dependency, every home charging setup delivers strongly positive ROI — even the most expensive premium charger without smart features pays back within 2 years against public charging costs.
Your Personal ROI Calculator — The Step-by-Step Framework
Here’s the framework to calculate your own break-even point:
Step 1: Calculate Your Net Upfront Cost
Hardware cost: £/$/€ ___
+ Installation quote: £/$/€ ___
+ Companion device (if needed): £/$/€ ___
= Total upfront: £/$/€ ___
- Federal/national tax credit: £/$/€ ___
- State/utility rebate: £/$/€ ___
- National grant (OZEV/ADVENIR/etc.): £/$/€ ___
= Net upfront cost: £/$/€ ___
Step 2: Calculate Your Annual kWh Requirement
Annual mileage: ___ miles (÷1.6 for km)
÷ EV efficiency (miles/kWh): ___
= Annual kWh consumed: ___
× 1.15 (charging losses)
= Annual kWh from charger: ___
Step 3: Calculate Your Annual Charging Cost (Current Setup)
If currently on public charging or standard rate:
Annual kWh × current cost per kWh = Annual charging cost: £/$/€ ___Step 4: Calculate Your Annual Charging Cost (After Home Charger)
Annual kWh × TOU off-peak rate = Annual charging cost: £/$/€ ___
(Solar owners: × (1 - solar fraction) for grid portion, solar portion = £0/$0/€0)
Step 5: Calculate Annual Net Saving
Current annual charging cost - New annual charging cost = Annual saving: £/$/€ ___
- Annual maintenance (typically £/$/€30-75): ___
= Net annual saving: £/$/€ ___
Step 6: Calculate Payback Period
Net upfront cost ÷ Net annual saving = Payback period in years: ___Step 7: Calculate 5-Year ROI
Net annual saving × 5 = 5-year total saving: £/$/€ ___
- Net upfront cost = 5-year net return: £/$/€ ___
÷ Net upfront cost × 100 = 5-year ROI: ___%
ROI Summary Table — All Scenarios Compared
| Scenario | Net Upfront Cost | Annual Net Saving | Payback Period | 5-Year ROI |
|---|---|---|---|---|
| US budget (Grizzl-E) vs public | $580 | $393 | 18 months | 239% |
| US smart TOU (ChargePoint) vs public | $609 | $763 | 10 months | 527% |
| US TOU + solar (Emporia, CA) | $322 | $915 | 4 months | 1,320% |
| US load management (Emporia, 100A panel) | $452 | $2,558 (year 1) | Immediate | N/A (one-time saving) |
| UK Zappi + Octopus Go + solar | £849 | £742 (vs std rate) | 14 months | 337% |
| UK Zappi + Octopus Go + solar | £849 | £2,072 (vs public) | 5 months | 1,120% |
| UK Andersen A2 vs public | £1,649 | £1,230 | 16 months | 273% |
| France Easee One + ADVENIR + solar | €211 | €317 | 8 months | 651% |
| Italy Wallbox + Bonus Colonnine vs public | €230 | €1,243 | 7 weeks | 2,602% |
The Factors That Most Affect Your Personal ROI
Based on the scenario modelling, five variables determine most of the variation in payback period and ROI:
Factor 1: Whether You Currently Rely on Public Charging
Against public charging dependency, every home charger scenario shows payback under 18 months. Against standard rate home charging (e.g., upgrading from a slow charger), payback takes longer. If you’re currently spending heavily on public charging, any home charger pays back faster than you might expect.
ROI impact: Moving from public charging to optimised home charging is worth $5,000-$10,000 over 5 years in the UK and $3,000-$6,000 in the US.
Factor 2: Whether You Switch to a Smart TOU Tariff
The difference between standard rate charging and TOU charging is £700-£900/year in the UK and $400-$900/year in the US. This single variable has more impact on ROI than any hardware choice.
ROI impact: TOU scheduling reduces payback period by 40-60% compared to standard rate charging.
Factor 3: Whether You Claim All Available Incentives
The difference between claiming no incentives and claiming all available incentives can be $500-$1,800 in the US, £350 in the UK, or €200-€1,200 in European markets. Missing incentives directly increases your net upfront cost and extends payback.
ROI impact: Full incentive claiming reduces payback period by 20-40% versus no incentives.
Factor 4: Whether You Have Solar Panels
Solar divert adds £95-£350/year in UK savings and $120-$600/year in US savings on top of TOU savings. For solar owners, every smart charger ROI calculation should include solar divert in the saving.
ROI impact: Solar adds 3-12 months of additional annual saving, compressing payback by 20-40%.
Factor 5: Whether Load Management Avoids a Panel Upgrade (US)
For 100-amp panel US homeowners, the panel upgrade question is the largest single financial variable — $1,500-$4,000 one-time cost that the Emporia Pro’s load management can avoid. This single factor can flip a marginal ROI case into a compelling one.
ROI impact: Avoiding a $2,500 median panel upgrade adds $2,500 to effective ROI in year 1.
When Home EV Charging Doesn’t Pay Back — The Honest Exceptions
The EV home charger ROI calculator 2026 when it pays off with rebates included analysis would be incomplete without acknowledging the scenarios where the ROI case is genuinely weak.
Exception 1: Very Low Annual Mileage
A driver covering 3,000 miles/year (typical retiree or secondary vehicle) charges approximately 986 kWh annually. At standard rates, this costs $158/year. Even free public charging would only save $158/year — the payback period for any home charger installation exceeds 5 years.
The honest recommendation: For very low mileage EV owners without access to free public charging, a basic portable EVSE from a NEMA 14-50 outlet is the right choice — lowest upfront cost, minimal installation. Don’t invest in a premium hardwired setup for 3,000 miles/year.
Exception 2: Renters Who Move Frequently
A renter who moves every 12-18 months and installs a hardwired charger loses the hardware value at each move (unless they can de-install and reinstall — possible but adds cost). Portable EVSE options (Grizzl-E Duo, JuiceBox 40 with NEMA 14-50) carry the ROI forward across moves. Fixed installations don’t.
The honest recommendation: Renters who move frequently should use portable EVSEs. The ROI calculation changes fundamentally when the hardware is abandoned at each move.
Exception 3: Home Sale Imminent
A homeowner planning to sell within 12 months installs a charger, sells the house, and leaves the hardware for the new owner. The payback period hasn’t elapsed. The investment hasn’t broken even.
The honest recommendation: If you’re selling within 12-18 months, check whether the charger adds value to the home sale price. In many markets, a properly installed home EV charger does add value — but the premium is typically £500-£1,500, not the full installation cost. Calculate the net value carefully.
Exception 4: Already Have Free Workplace or Destination Charging
If your employer provides free EV charging and you commute daily, your home charging need is minimal. The saving from home charging versus free workplace charging is approximately zero — you’re comparing £0 to £189/year on Octopus Go + solar. The payback from home charging against free charging is very long.
The honest recommendation: Assess your actual charging pattern honestly. If 80% of your charging is free at work, the ROI case for a sophisticated home charging setup is significantly weaker than the scenarios modelled above.
The Battery Longevity Bonus — An ROI Factor Nobody Includes
There’s a rarely discussed financial benefit of home Level 2 charging that doesn’t appear in any standard ROI calculation but is worth acknowledging.
Frequent DC fast charging accelerates battery degradation compared to regular Level 2 AC charging. The lithium-ion cells in EV batteries prefer slower, lower-temperature charging — the conditions that Level 2 AC charging provides.
The financial implication:
- Battery replacement costs for mainstream EVs: $5,000-$20,000 depending on vehicle
- Battery degradation from regular DC fast charging vs Level 2: 10-20% faster capacity loss over 5-8 years
- If home Level 2 charging extends battery life by 1-2 years before replacement threshold is reached: $1,000-$4,000 in deferred battery replacement costs
This is a probabilistic benefit — not all EV owners will replace their battery, and battery technology is improving. But for high-mileage EV owners who previously relied on DC fast charging, the switch to primarily home Level 2 charging has a battery longevity benefit that adds to the ROI case in ways that are difficult to quantify precisely but real nonetheless.
Internal Links — Further Reading on Clean Energy Bazaar
The EV home charger ROI calculator 2026 when it pays off with rebates included guide is the financial synthesis of every charger selection guide on this site.
For the full 5-year true cost analysis that provides the cost framework this ROI calculator builds on, our 5-year true cost of home EV charger ownership 2026 US vs Europe comparison covers every component. For the TOU tariff savings that are the single most impactful variable in the ROI calculation, our time-of-use EV charging savings smart chargers that cut bills in US and Europe guide covers every tariff and charger combination. For the US rebates that reduce the net upfront cost in the ROI formula, our US EV charger rebates by state 2026 guide covers every major programme. For European grants that similarly reduce net upfront cost, our EV home charging incentives Europe 2026 guide covers every country. For the load management feature that can avoid a $1,500-$4,000 panel upgrade and transform US ROI calculations, our load balancing EV chargers 2026 guide covers the full picture. For the smart feature financial value assessments that feed into this ROI model, our smart EV chargers 2026 features worth the cost guide gives specific timelines. And for the installation cost component — the second largest variable in the ROI upfront cost — our professional EV charger installation costs 2026 guide covers every market honestly.
Final Thoughts
The EV home charger ROI calculator 2026 when it pays off with rebates included analysis delivers a clear and consistent conclusion across every scenario modelled.
A home EV charger pays back. Quickly. In almost every realistic scenario. The payback period ranges from 7 weeks (Italy Bonus Colonnine against public charging) to 18 months (US budget setup against public charging) — with most optimised smart charger scenarios paying back in 4-14 months.
The variables that most determine your specific payback period are not the hardware you choose — they’re the tariff you’re on, the incentives you claim, and whether you have solar. Optimise those three variables first.
The five actions that most compress your payback period:
- Switch to the best available TOU tariff before installing your charger. This single action adds £700-£900/year to your annual saving in the UK, $400-$900/year in the US.
- Claim every applicable incentive before purchasing. Federal tax credit, state rebate, utility rebate, OZEV grant, ADVENIR, Bonus Colonnine — missing any one of these extends payback by months.
- Choose solar divert capability if you have solar panels. The additional £95-£350/year in solar savings compresses payback by 20-40%.
- Choose load management over panel upgrade if you’re a US homeowner on a 100-amp panel. The $1,500-$4,000 panel upgrade avoided is immediate positive ROI.
- Compare against public charging costs honestly. If you’re currently spending heavily on public charging, your payback period is measured in months, not years — regardless of which charger you choose.
The investment case for home EV charging is strong. This guide gives you the numbers to know exactly how strong for your specific situation.