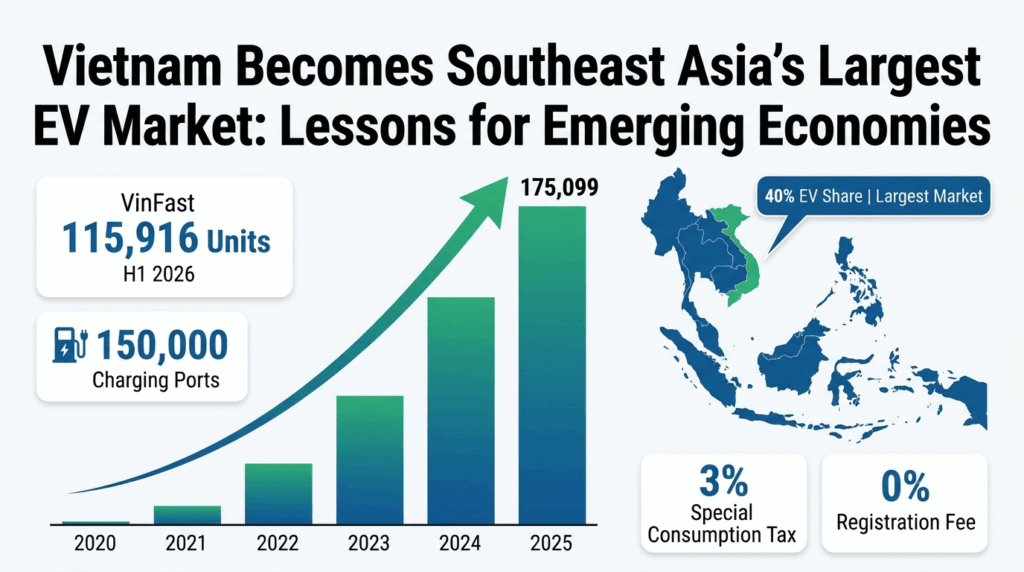
Vietnam becomes Southeast Asia's largest EV market: lessons for emerging economies - infographic showing Vietnam reaching nearly 40 percent EV share in 2025 with 175,099 VinFast deliveries, 150,000 charging ports, and zero registration fees
EV charging

Vietnam Becomes Southeast Asia’s Largest EV Market: Lessons for Emerging Economies

Vietnam becomes Southeast Asia’s largest EV market: lessons for emerging economies. Nearly 40% of new car sales were electric in 2025, with VinFast delivering 175,099 vehicles and capturing essentially the entire BEV market. Registration fee exemptions and a 3% special consumption tax reduced the upfront price of EVs. V-Green built 150,000 charging ports ahead of demand. This analysis breaks down the data, the policy framework, the affordability strategy, the charging network, and the lessons for other developing economies.
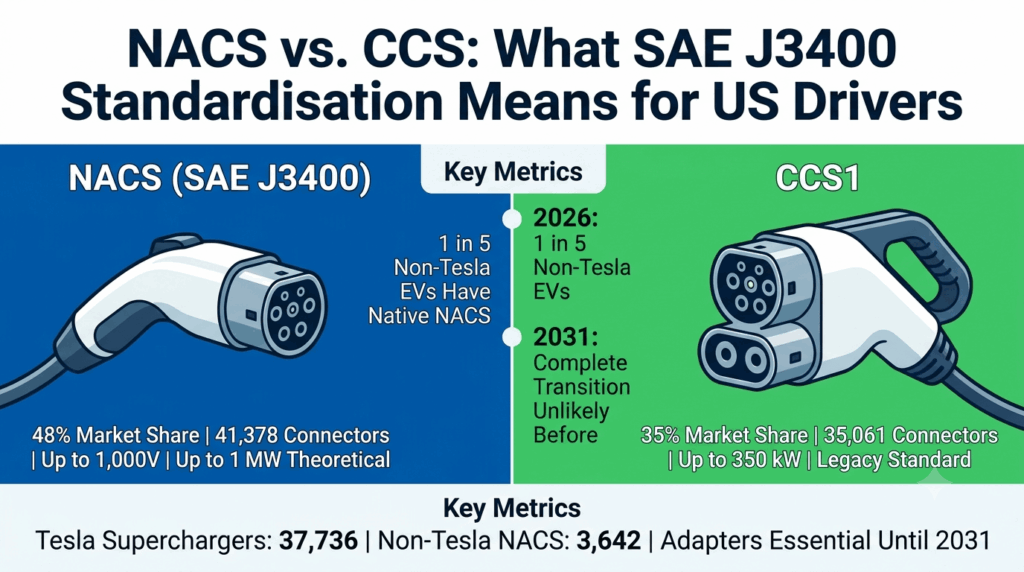
NACS vs. CCS: what SAE J3400 standardisation means for US drivers - comparison chart showing NACS 48 percent and CCS1 35 percent market share, automaker native NACS timelines through 2027, and the $660 million retrofit cost that makes adapters essential
EV charging

NACS vs. CCS: What SAE J3400 Standardisation Means for US Drivers

NACS vs. CCS: what SAE J3400 standardisation means for US drivers. NACS now holds 48% of US fast-charging connectors, but CCS remains 40% and adapters will be needed until at least 2031. This practical guide breaks down the J3400 standard, the 1,000-volt and 1 MW capability, the adapter economy, the automaker timelines, the NEVI dual-standard requirements, and what drivers actually need to know before buying their next EV

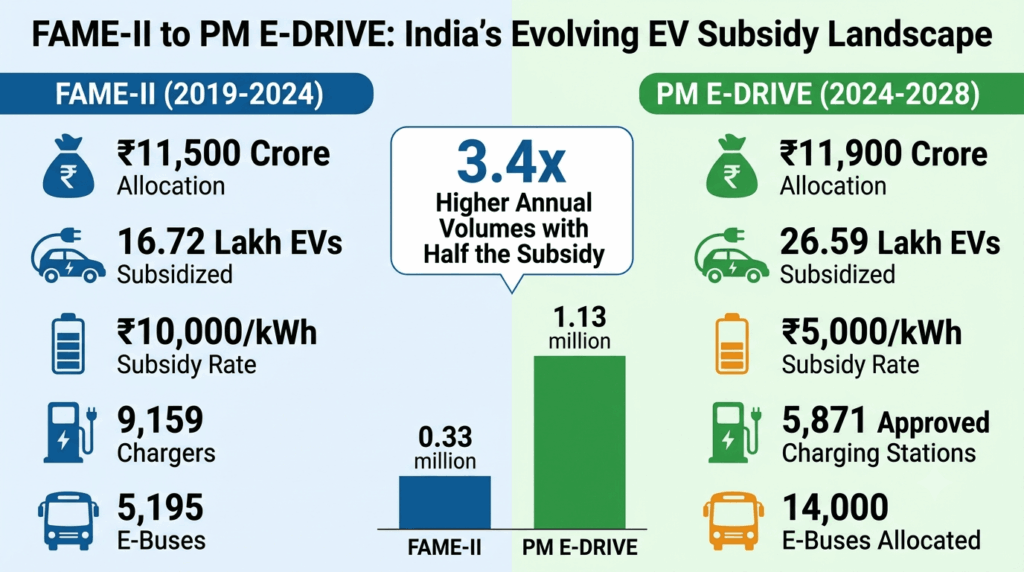
FAME-II to PM E-DRIVE: India's evolving EV subsidy landscape - comparison chart showing FAME-II with ₹11,500 crore and 16.72 lakh EVs versus PM E-DRIVE with ₹11,900 crore and 26.59 lakh EVs, annualised volumes, state-wise adoption, and the 3.4x efficiency gain
EV charging

FAME-II to PM E-DRIVE: India’s Evolving EV Subsidy Landscape

FAME-II to PM E-DRIVE: India’s evolving EV subsidy landscape. PM E-DRIVE delivered 3.4 times higher annual EV volumes with half the per-kWh subsidy, supported 26.59 lakh vehicles as of June 2026, and shifted the market mix toward electric two-wheelers. But charging infrastructure deployment has lagged, and adoption remains uneven across states. This data-driven analysis compares the two schemes, the CEEW findings, the state-level patterns, and what comes next.

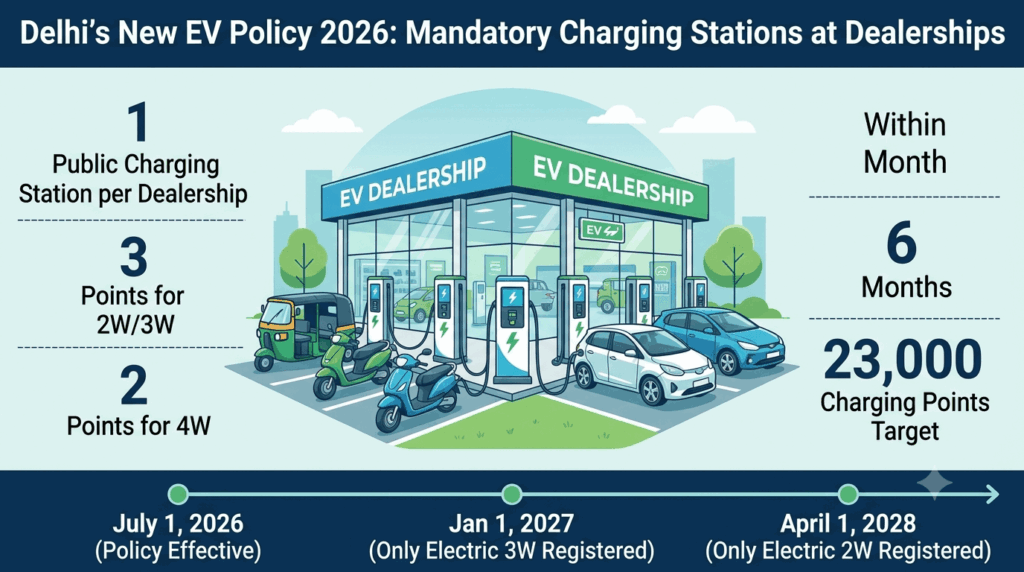
Delhi's new EV policy 2026: mandatory charging stations at dealerships - infographic showing one public charging station required at each dealership with three points for two-wheelers and two for four-wheelers within six months, and 23,000 charging points target
EV charging

Delhi’s New EV Policy 2026: Mandatory Charging Stations at Dealerships

Delhi’s new EV policy 2026: mandatory charging stations at dealerships. Every OEM operating in Delhi must install at least one public charging station at each dealership within six months, with a minimum of three charging points for two- and three-wheelers and two for four-wheelers. The policy also introduces a single-window clearance system, designates Delhi Transco Limited as the nodal agency, and sets phased registration deadlines phasing out new ICE two-wheelers from April 2028. This analysis breaks down the mandate, the incentives, the dealer impact, and the charging infrastructure expansion.

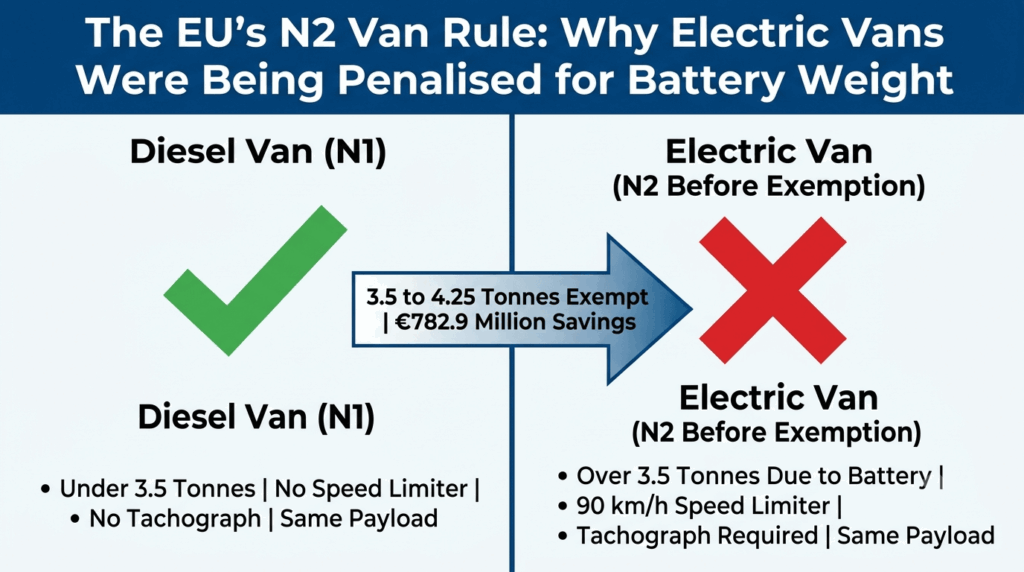
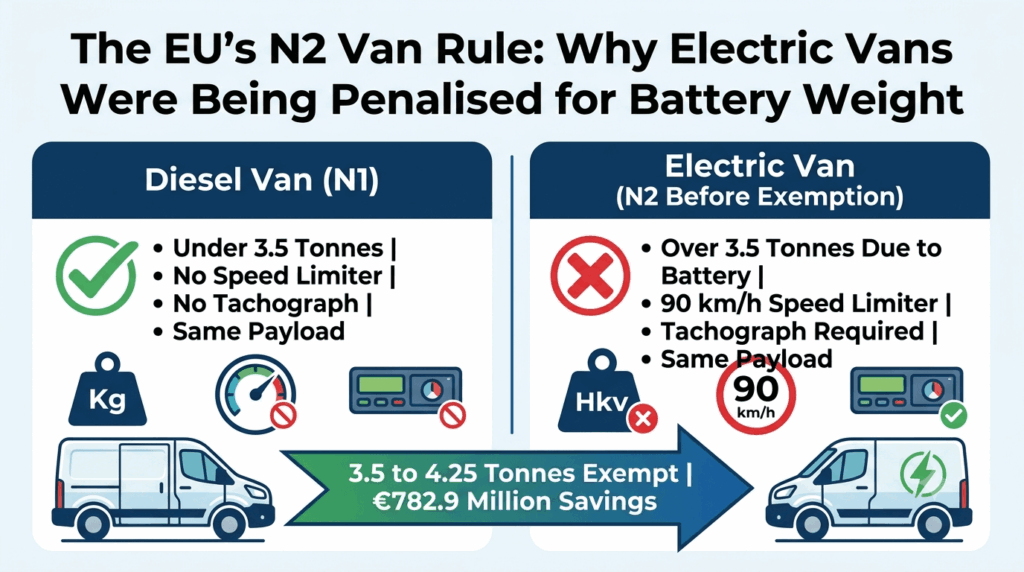
The EU's N2 van rule: why electric vans were being penalised for battery weight - infographic showing diesel vans under 3.5 tonnes with no speed limiter versus electric vans pushed into N2 category by battery weight facing 90 km/h speed limiters, with the exemption covering 3.5 to 4.25 tonne vehicles
EV charging

The EU’s N2 Van Rule: Why Electric Vans Were Being Penalised for Battery Weight

The EU’s N2 van rule: why electric vans were being penalised for battery weight. The 3.5 tonne threshold pushed e-vans into truck classification, triggering speed limiter mandates that diesel vans with identical payloads did not face. The European Commission’s exemption for N2 electric vans between 3.5 and 4.25 tonnes removes that anomaly, with estimated savings of €223.7 million to €782.9 million from 2027 to 2029. This analysis breaks down the regulatory problem, the exemption details, the cost savings, the road safety debate, and the legislative process.

The EU's N2 van rule: why electric vans were being penalised for battery weight - infographic showing diesel vans under 3.5 tonnes with no speed limiter versus electric vans pushed into N2 category by battery weight facing 90 km/h speed limiters, with the exemption covering 3.5 to 4.25 tonne vehicles
Uncategorized

The EU’s N2 Van Rule: Why Electric Vans Were Being Penalised for Battery Weight

The EU’s N2 van rule: why electric vans were being penalised for battery weight. The 3.5 tonne threshold pushed e-vans into truck classification, triggering speed limiter mandates that diesel vans with identical payloads did not face. The European Commission’s exemption for N2 electric vans between 3.5 and 4.25 tonnes removes that anomaly, with estimated savings of €223.7 million to €782.9 million from 2027 to 2029. This analysis breaks down the regulatory problem, the exemption details, the cost savings, the road safety debate, and the legislative process.

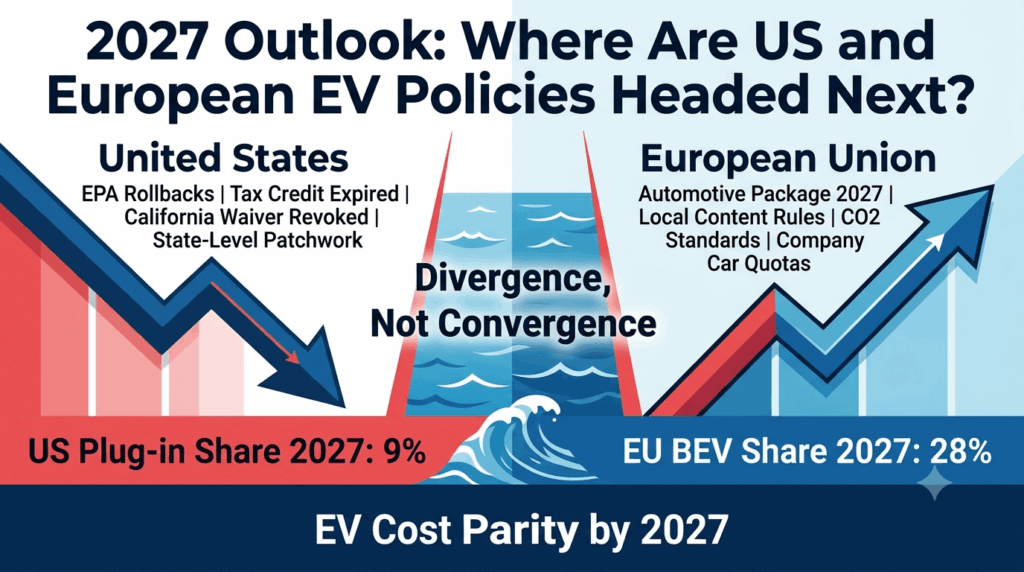
2027 outlook: where are US and European EV policies headed next? Infographic showing US policy withdrawal with EPA rollbacks and state-level resistance versus EU regulatory consolidation with local content rules and company car quotas, projecting 9 percent US plug-in share and 28 percent EU BEV share in 2027
EV charging

2027 Outlook: Where Are US and European EV Policies Headed Next?

The 2027 outlook for US and European EV policies points to divergence, not convergence. This analysis breaks down the EPA rollbacks and state-level resistance in the United States, the EU Automotive Package delay and local content rules, the cost convergence underway as battery prices fall, and what the next regulatory cycle actually means for manufacturers and buyers on both sides of the Atlantic.

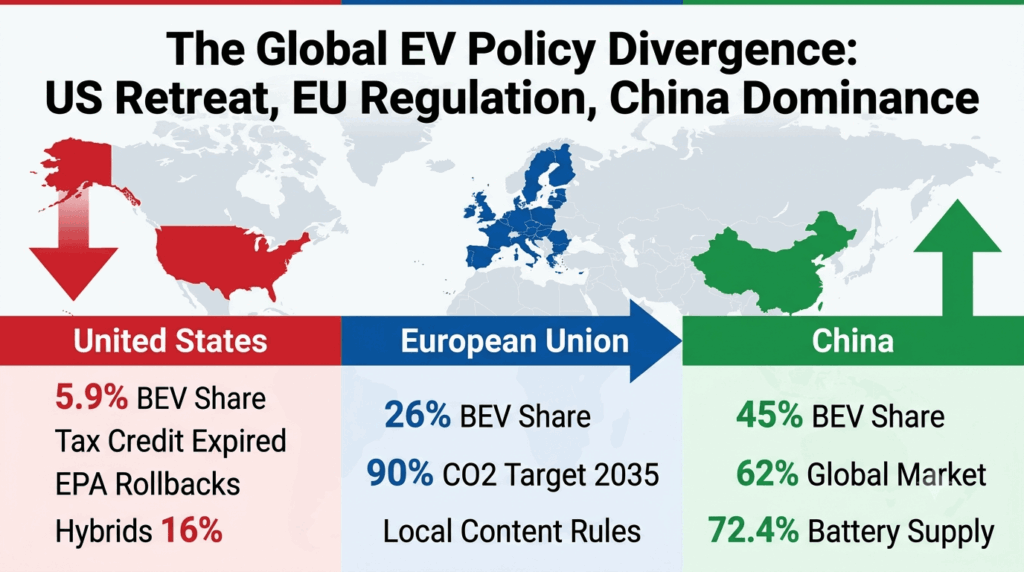
The global EV policy divergence: US retreat, EU regulation, China dominance - infographic showing US BEV share at 5.9 percent with tax credit expired, EU at 26 percent with 90 percent CO2 target, and China at 45 percent with 62 percent global market share
EV charging

The Global EV Policy Divergence: US Retreat, EU Regulation, China Dominance

The global EV policy divergence: US retreat, EU regulation, China dominance. The United States has completed a comprehensive withdrawal from EV support, with BEV market share falling to 5.9% while hybrids reach a record 16%. Europe has recalibrated its 2035 targets to 90% while maintaining regulatory pressure. China now holds 62% of the global EV market. This analysis breaks down the three trajectories, the policy decisions behind them, and what the divergence means for automakers, consumers, and the global energy transition.

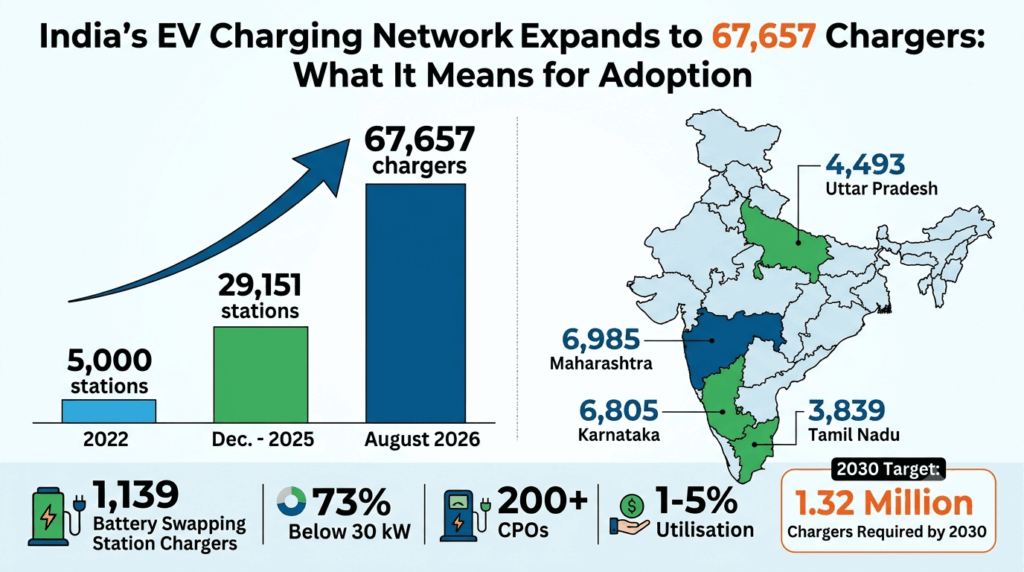
India's EV charging network expands to 67,657 chargers: what it means for adoption - infographic showing growth from 5,000 stations in 2022 to 67,657 chargers in August 2026, with 1,139 battery swapping chargers, 73 percent below 30 kW, and 1.32 million chargers required by 2030
EV charging

India’s EV Charging Network Expands to 67,657 Chargers: What It Means for Adoption

India’s EV charging network expands to 67,657 chargers: what it means for adoption. The network has grown six-fold since 2022, with 29,151 public charging stations and 1,139 battery swapping station chargers. But 73 percent of chargers are below 30 kW, utilisation remains stuck at 1 to 5 percent, and the deployment of approved PM E-DRIVE chargers has not yet begun. This analysis breaks down the numbers, the state-level distribution, the utilisation paradox, the policy pipeline, and the 1.32 million charger target for 2030.

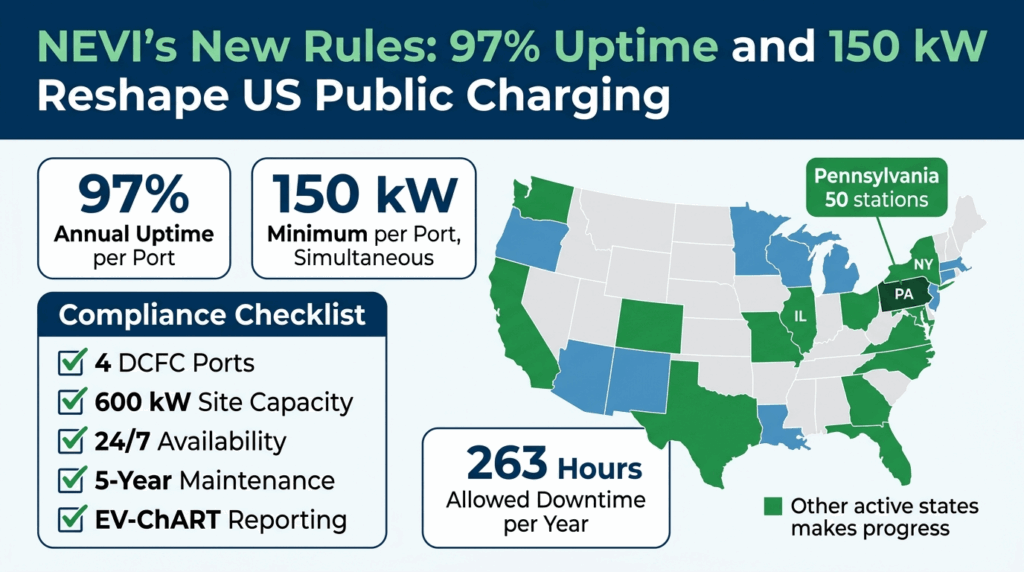
NEVI's new rules: 97% uptime and 150 kW reshape US public charging - infographic showing 97 percent annual uptime per port, 150 kW minimum simultaneous power, four DCFC ports per site, and the 263-hour annual downtime allowance
EV charging

NEVI’s New Rules: 97% Uptime and 150 kW Reshape US Public Charging

NEVI’s new rules: 97% uptime and 150 kW reshape US public charging. The FHWA’s August 2025 guidance keeps the 97% annual uptime mandate and 150 kW minimum per port. This analysis breaks down the regulatory definition of uptime, the simultaneous power requirement, the enforcement mechanisms, the state-level implementation, the Buy America question, and what the standards actually mean for drivers and operators.

Scroll to Top