Author name: kartikey.ajay@gmail.com

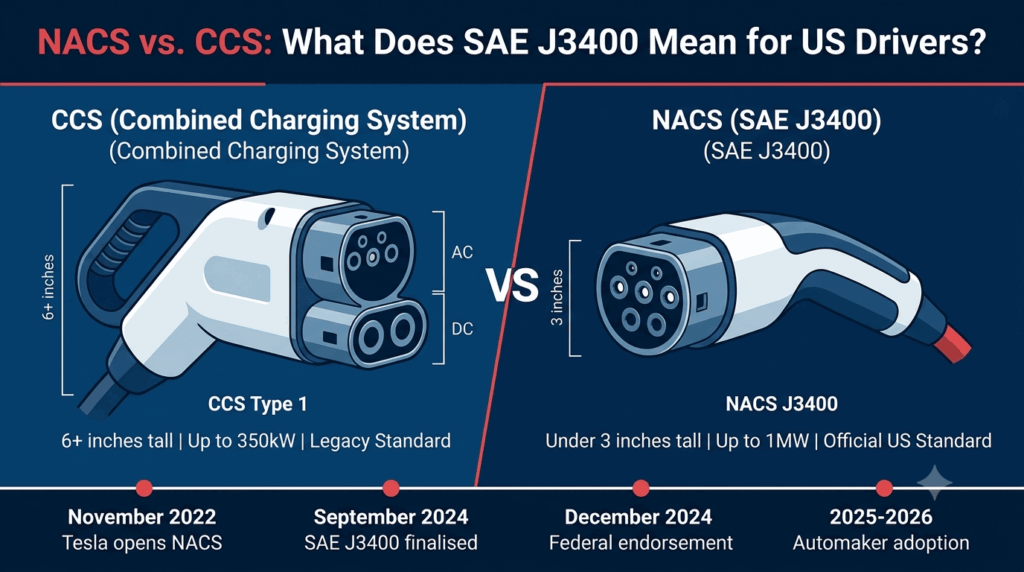
NACS vs. CCS: what does the standardization (SAE J3400) mean for US drivers? Infographic comparing CCS connector (6+ inches, up to 350kW) with NACS/SAE J3400 connector (under 3 inches, up to 1MW, official US standard) with timeline from 2022 to 2026
EV charging

NACS vs. CCS: What Does the Standardization (SAE J3400) Mean for US Drivers? The Honest Complete Guide

NACS vs. CCS: what does the standardization (SAE J3400) mean for US drivers? The honest answer is that it means the end of connector chaos in North America. This complete guide breaks down the SAE J3400 standardisation of Tesla’s NACS connector (formalised September 2024, federal endorsement December 2024), the technical advantages (1000V capability, up to 1 MW power, half the size of CCS, native bidirectional support), the automaker adoption timeline (every major OEM committed, native NACS becoming the norm by end of 2026), the transition challenges (CCS remains substantial, adapters essential), and what it all means for current and future EV buyers.
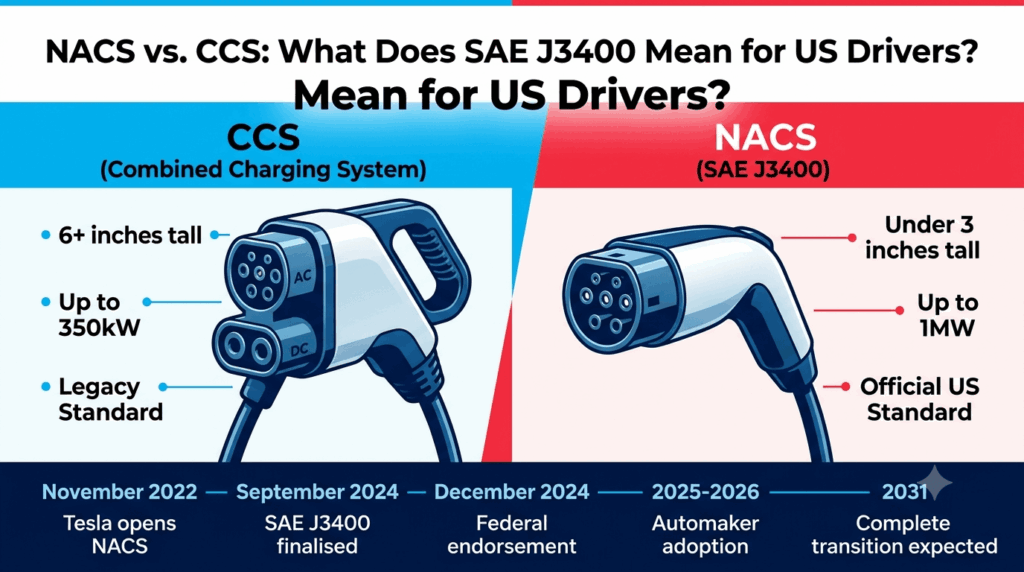
NACS vs. CCS: what does the standardization (SAE J3400) mean for US drivers? Infographic comparing CCS connector (6+ inches, up to 350kW) with NACS/SAE J3400 connector (under 3 inches, up to 1MW, official US standard) with timeline from 2022 to 2031
EV charging

NACS vs. CCS: What Does the Standardization (SAE J3400) Mean for US Drivers? The Honest Complete Guide

NACS vs. CCS: what does the standardization (SAE J3400) mean for US drivers? — and the honest answer is that it means the end of connector chaos in North America. This complete guide breaks down the SAE J3400 standardisation of Tesla’s NACS connector (formalised September 2024, federal endorsement December 2024), the technical advantages (1000V capability, up to 1 MW power, half the size of CCS, native bidirectional support), the automaker adoption timeline (every major OEM committed, 90% NACS by end of 2026), the transition challenges (CCS remains 40% of network, complete transition unlikely before 2031, $660 million retrofit cost), the adapter solution, and what it all means for current and future EV buyers.
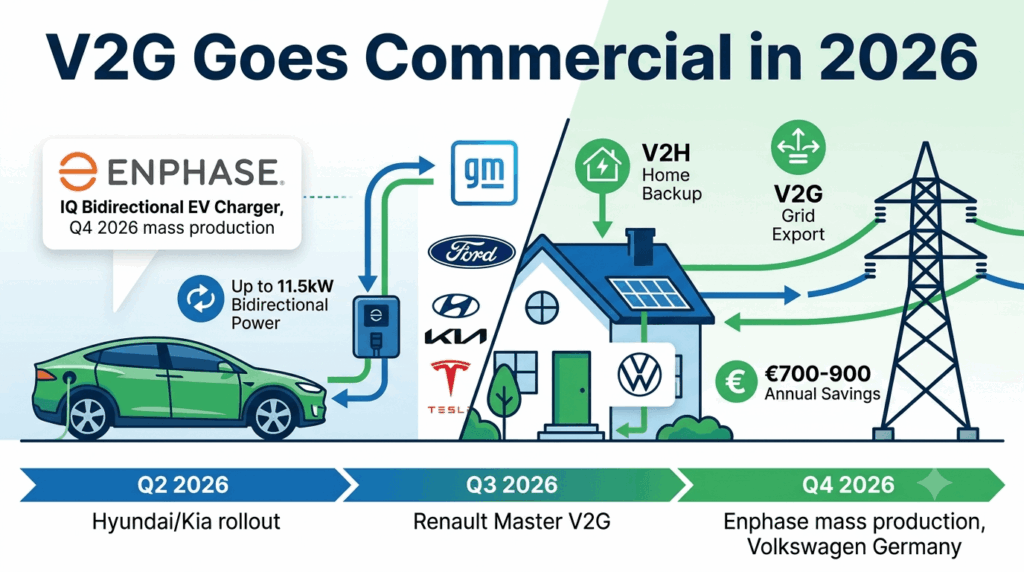
V2G goes commercial in 2026: Enphase, GM, Ford, Hyundai, Kia, Tesla launch platforms — infographic showing Enphase IQ Bidirectional EV Charger Q4 2026 mass production, GM V2G push, Ford F-150 Lightning V2H, Hyundai AllDayEnergy, Tesla Cybertruck V2G, and Volkswagen Elli V2G offering
EV charging

V2G Goes Commercial in 2026: Enphase, GM, Ford, Hyundai, Kia, Tesla Launch Platforms — The Honest Complete Guide

V2G goes commercial in 2026: Enphase, GM, Ford, Hyundai, Kia, Tesla launch platforms — and the second half of the year is shaping up to be the moment when bidirectional charging finally moves from promise to practice. This complete guide breaks down Enphase’s IQ Bidirectional EV Charger (Q4 2026 mass production, open standards, up to 11.5kW), GM’s nationwide V2G push (bidirectional as a foundational standard, 250,000+ capable vehicles, PG&E partnership), Ford’s F-150 Lightning (9.6kW home backup, two to three days of power), Hyundai’s AllDayEnergy (V2X service launching H2 2026 in the UK), Tesla’s Cybertruck (Powershare Grid Support, PG&E V2X programme), Volkswagen’s Elli V2G offering (Germany Q4 2026, €700-900 annual savings), and what it all means for EV owners.

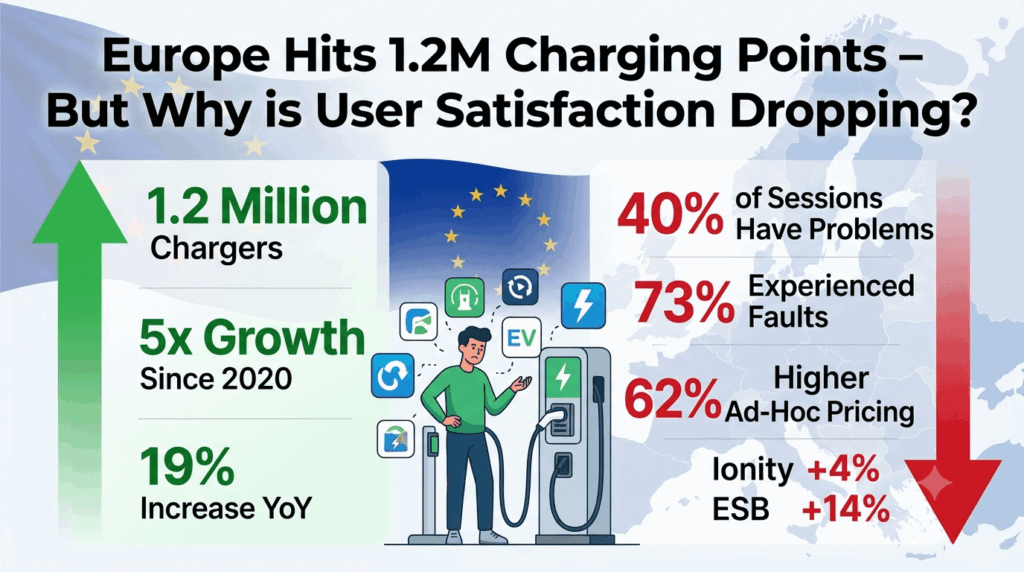
Europe hits 1.2M charging points – but why is user satisfaction dropping? Infographic showing 1.2 million public chargers with 5x growth since 2020, alongside 40 percent of charging sessions having problems, 73 percent experiencing faults, and rising costs with Ionity up 4 percent and ESB up 14 percent
EV charging

Europe Hits 1.2M Charging Points – But Why is User Satisfaction Dropping? The Honest Complete Guide

Europe hits 1.2M charging points – but why is user satisfaction dropping? — and the honest answer is that Europe has focused on quantity over quality. This complete guide breaks down the infrastructure milestone (1.23 million public chargers, near five-fold increase since 2020), the satisfaction paradox (88% overall EV satisfaction but nearly 40% of charging sessions have problems), the payment friction (multiple apps, fragmented systems, “spayment anxiety”), the rising costs (Ionity +4%, ESB +14%, rates exceeding €1.00/kWh), the price transparency problem (AFIR implementation incomplete), and what it all means for European EV drivers.

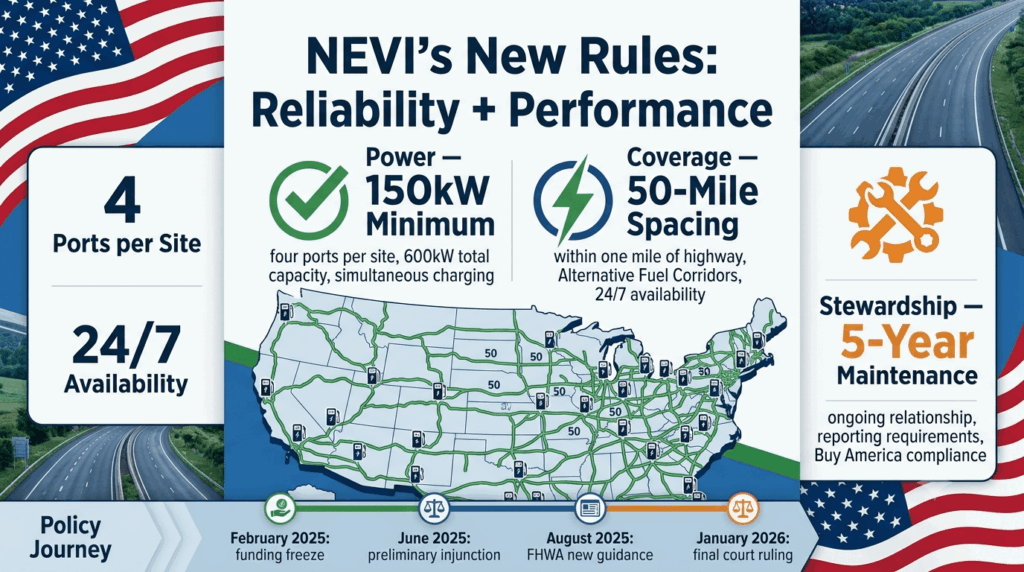
NEVI's new rules: 97% uptime + 150kW – the US raises the bar for public chargers — infographic showing federal standards requiring 97 percent annual uptime, 150kW minimum per port, four ports per site, 50-mile spacing, 24/7 availability, and five-year maintenance for NEVI-funded EV charging stations
EV charging

NEVI’s New Rules: 97% Uptime + 150kW – The US Raises the Bar for Public Chargers — The Honest Complete Guide

NEVI’s new rules: 97% uptime + 150kW – the US raises the bar for public chargers — and for the first time, America has a federal standard that demands EV charging infrastructure that is actually reliable, actually fast, and actually usable. This complete guide breaks down the NEVI technical requirements (97% annual uptime, 150kW minimum per port, four ports per site, 50-mile spacing, 24/7 availability, five-year maintenance), the policy rollercoaster (January 2025 funding freeze, court ruling restoring access, August 2025 FHWA guidance), what the standards mean for charging networks and EV drivers, and the honest assessment of whether America can deliver on this ambitious vision.

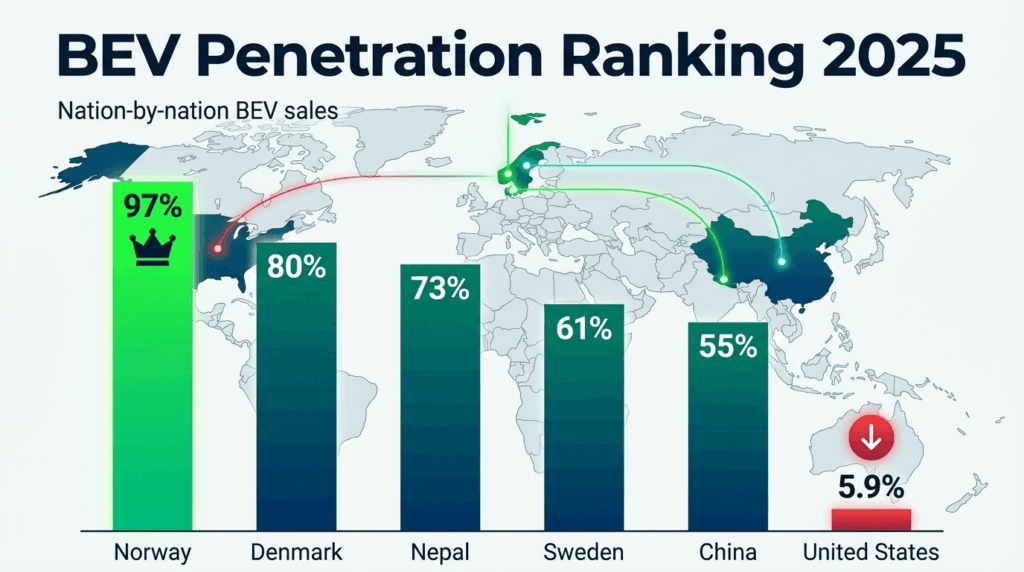
Nation-by-nation BEV penetration ranking: Norway at 97.9%, Denmark at 80%, US at 5.9% — infographic showing Norway leading at 97 percent, Denmark at 80 percent, Nepal at 73 percent, Sweden at 61 percent, China at 55 percent, and United States at 5.9 percent
EV charging

Nation-by-Nation BEV Penetration Ranking: Norway at 97.9%, Denmark at 80%, US at 5.9% — The Honest Complete Guide

Nation-by-nation BEV penetration ranking: Norway at 97.9%, Denmark at 80%, US at 5.9% — and the gap between the leaders and laggards tells a story about policy, affordability, and political will. This complete guide breaks down the IEA and national data revealing the global EV pecking order: Norway’s near-complete transition (95.9% full-year, 97.6% in December), Denmark’s December surge (80.95% BEV share), and the US collapse (5.9% in October 2025 after the $7,500 tax credit expired). We analyse the top performers (Nepal 73%, Sweden 61%, China 55%), the emerging market surge (Vietnam 37%, Thailand 24%), and the policy lessons that explain the extremes.

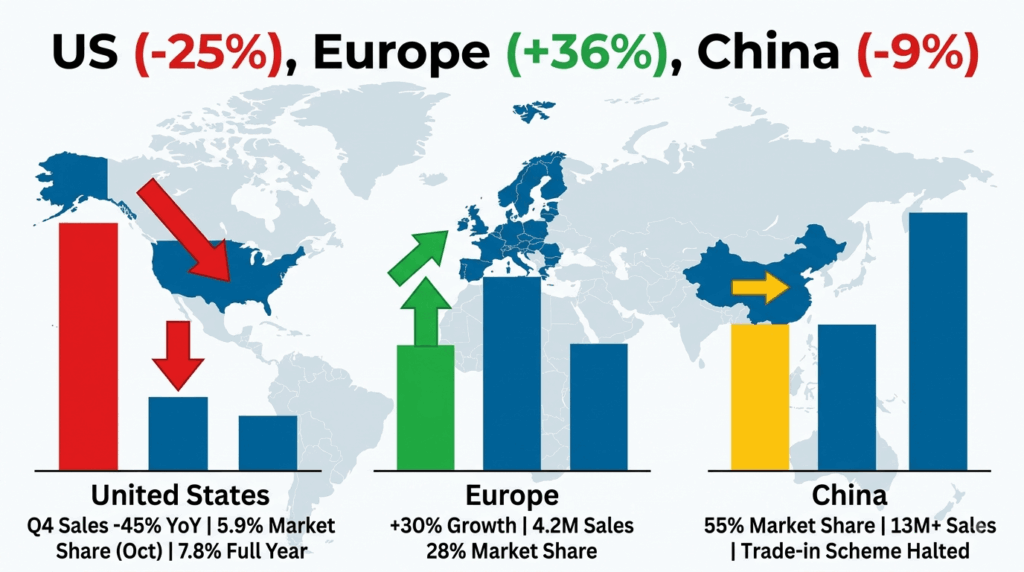
US (-25%), Europe (+36%), China (-9%) — infographic showing US EV sales collapse with Q4 down 45 percent and 5.9 percent market share, Europe surge with 30 percent growth and 28 percent market share, China slowdown with 55 percent market share and 13 million sales
EV charging

US (-25%), Europe (+36%), China (-9%) — The Global EV Sales Comparison You Need to See — The Honest Complete Guide

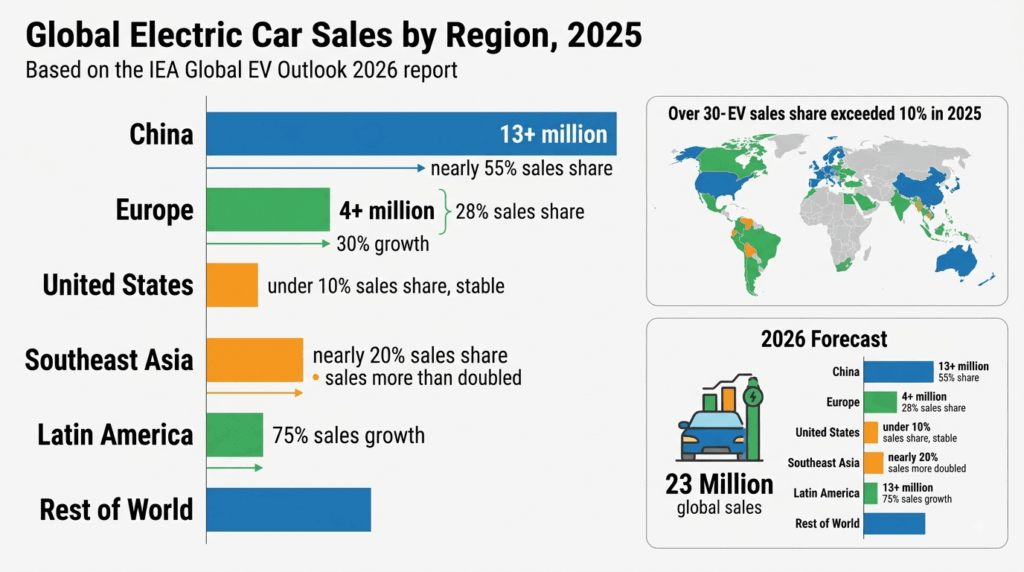
US (-25%), Europe (+36%), China (-9%) — these three numbers capture the state of the global EV market in 2025 more accurately than any single global statistic. This complete comparison guide breaks down the IEA Global EV Outlook 2026 data region by region: the US collapse (Q4 sales down 45% after the $7,500 tax credit expired, first annual decline in a decade), the European surge (30% growth to 4.2 million sales, 28% market share, driven by stricter CO₂ standards), and the Chinese slowdown (trade-in scheme halt cools the world’s largest market, but 55% share remains). We analyse the policy drivers, the country-level performances, the 2026 outlook, and what it all means for EV buyers in each region.

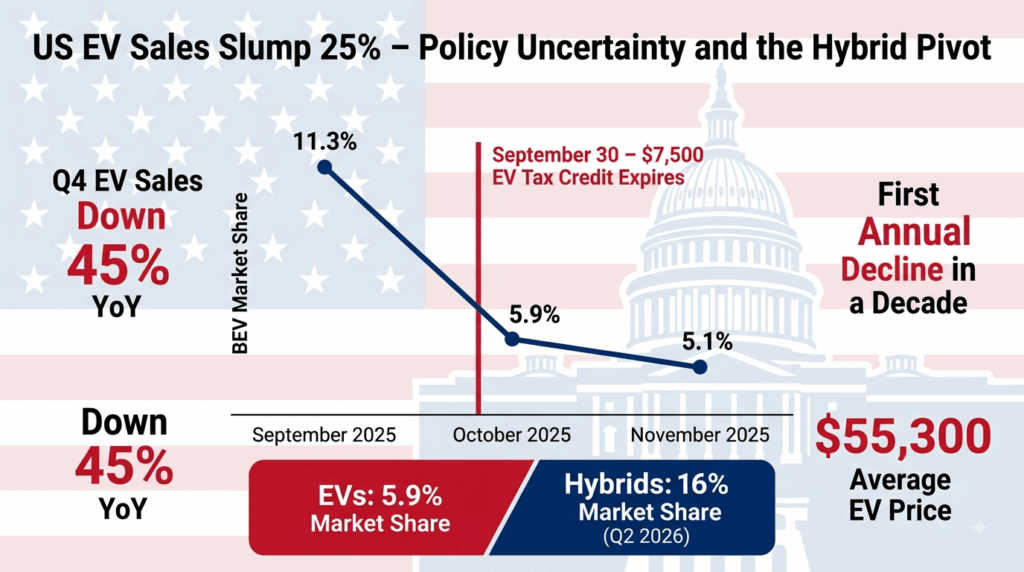
US EV sales slump 25% – policy uncertainty and the hybrid pivot — infographic showing BEV market share collapse from 11.3 percent in September 2025 to 5.9 percent in October 2025 after $7,500 EV tax credit expired, with hybrid vehicles reaching record 16 percent market share
EV charging

US EV Sales Slump 25% – Policy Uncertainty and the Hybrid Pivot — The Honest Complete Guide

US EV sales slump 25% – policy uncertainty and the hybrid pivot — and the data tells a story of a market that was artificially inflated by federal policy and then artificially deflated by its removal. This complete analysis breaks down the collapse: BEV market share fell from 11.3% in September 2025 to 5.9% in October after the $7,500 federal tax credit expired, marking the first annual EV sales decline in a decade. We examine the policy earthquake (the One Big Beautiful Bill Act, emissions rollbacks, NEVI funding freeze), the hybrid surge (36% growth, record 16% market share), the price barriers ($55,300 average EV price), the automaker response (Ford F-150 Lightning discontinued, Ram 1500 REV canceled), and what this all means for American EV buyers.

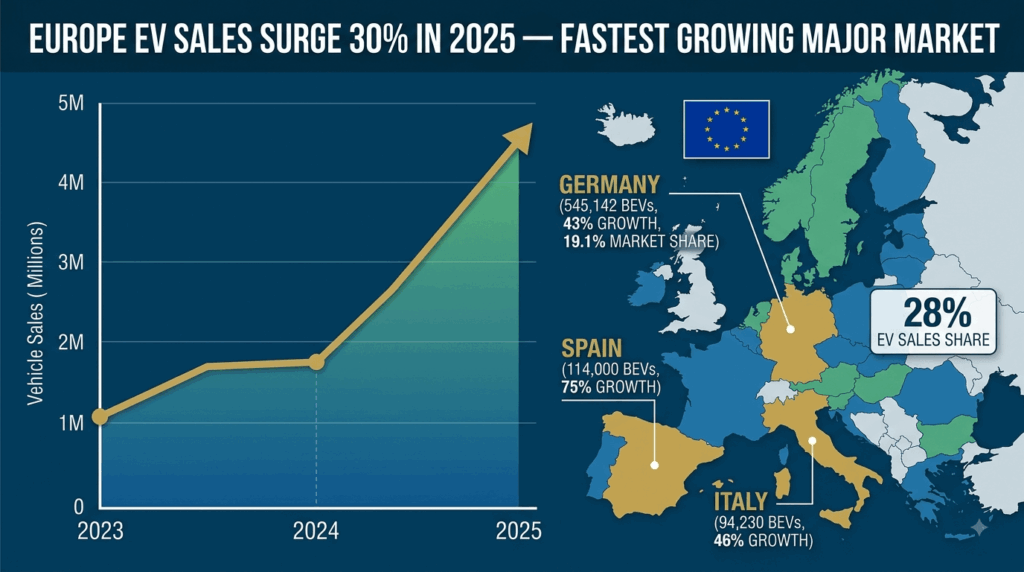
Europe's EV sales surge 30% – how Germany, Spain, and Italy are leading the comeback — infographic showing 4+ million EV sales in Europe 2025 with 28 percent market share, Germany 545,142 BEVs at 43 percent growth, Spain 114,000 BEVs at 75 percent growth, Italy 94,230 BEVs at 46 percent growth
EV charging

Europe’s EV Sales Surge 30% – How Germany, Spain, and Italy Are Leading the Comeback — The Honest Complete Guide

Europe’s EV sales surge 30% – how Germany, Spain, and Italy are leading the comeback — and the data confirms that the reversal is real, substantial, and accelerating. This complete breakdown of Europe’s remarkable EV rebound covers the IEA Global EV Outlook 2026 data (4+ million sales, 28% market share, strongest growth among major markets), the country-by-country performance (Germany 545,142 BEVs, 43% growth; Spain 114,000 BEVs, 75% growth; Italy 94,230 BEVs, 46% growth), the policy drivers (EU CO2 standards step change), the energy crisis factor (35% fuel cost savings increase), the 2026 outlook (one in three cars electric), and what it all means for European EV buyers.

IEA Global EV Outlook 2026: 2025 sales hit 20M, capturing 25% of global car sales — infographic showing 20 million EV sales in 2025 with 25 percent market share, 23 million forecast for 2026, regional breakdowns for China, Europe, and US, and key metrics on oil displacement and battery deployment
EV charging

IEA Global EV Outlook 2026: 2025 Sales Hit 20M, Capturing 25% of Global Car Sales — The Honest Complete Guide

IEA Global EV Outlook 2026: 2025 sales hit 20M, capturing 25% of global car sales — and the numbers tell a story of a transition that is no longer coming. It is here. This complete summary of the IEA’s flagship report breaks down the 20 million EV sales in 2025 (20% growth, one in four new cars), the 23 million forecast for 2026 (nearly 30% of global sales), the regional performances (China 13 million, Europe 30% growth, US stable at 10%), the emerging market surge (Southeast Asia doubled, Latin America 75% growth), the battery and supply chain implications (1.2 TWh deployed, China 80% of cell production), the oil displacement impact (1.7 million barrels per day, rising to 5 million by 2030), and what it all means for EV buyers.

Scroll to Top