Author name: kartikey.ajay@gmail.com

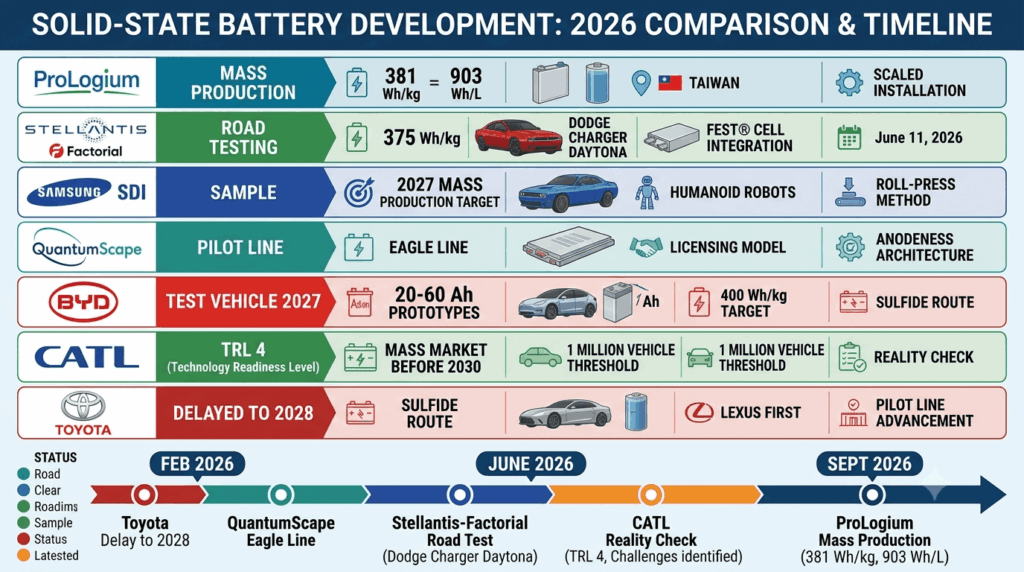
The 2026 solid-state battery reality check: what actually shipped - comparison chart showing ProLogium mass production, Stellantis Factorial road testing, Samsung SDI 2027 target, QuantumScape pilot line, BYD 2027 test vehicle, CATL TRL 4, and Toyota delay to 2028
EV charging

The 2026 Solid-State Battery Reality Check: What Actually Shipped

The 2026 solid-state battery reality check: what actually shipped. ProLogium began mass production of its Gen 3.5 all-solid-state battery at 381 Wh/kg, verified by TÜV and UL Solutions. Stellantis and Factorial launched North America’s first solid-state road test in a Dodge Charger Daytona. But CATL stated mass-market deployment is unlikely before 2030, Toyota delayed its production timeline to 2028, and no mass-market EV was equipped with a solid-state battery. This analysis breaks down what actually shipped, what remained in the lab, and the honest state of play.
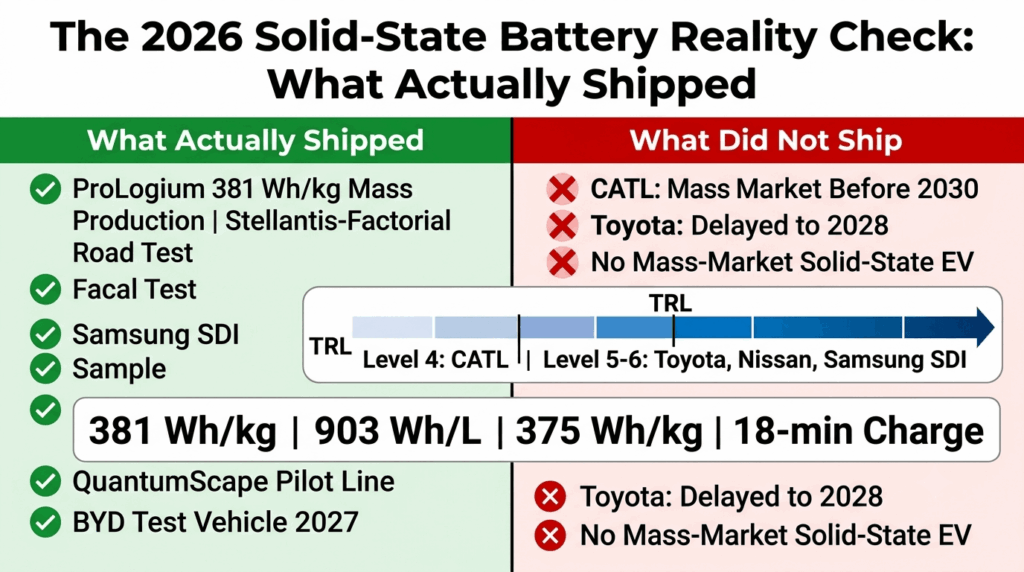
The 2026 solid-state battery reality check: what actually shipped - infographic showing ProLogium mass production at 381 Wh/kg, Stellantis Factorial road testing at 375 Wh/kg, but CATL stating mass market before 2030 and Toyota delaying to 2028
EV charging

The 2026 Solid-State Battery Reality Check: What Actually Shipped

The 2026 solid-state battery reality check: what actually shipped. ProLogium began mass production of its Gen 3.5 all-solid-state battery at 381 Wh/kg, verified by TÜV and UL Solutions. Stellantis and Factorial launched North America’s first solid-state road test in a Dodge Charger Daytona. But CATL stated mass-market deployment is unlikely before 2030, Toyota delayed its production timeline to 2028, and no mass-market EV was equipped with a solid-state battery. This analysis breaks down what actually shipped, what remained in the lab, and the honest state of play.
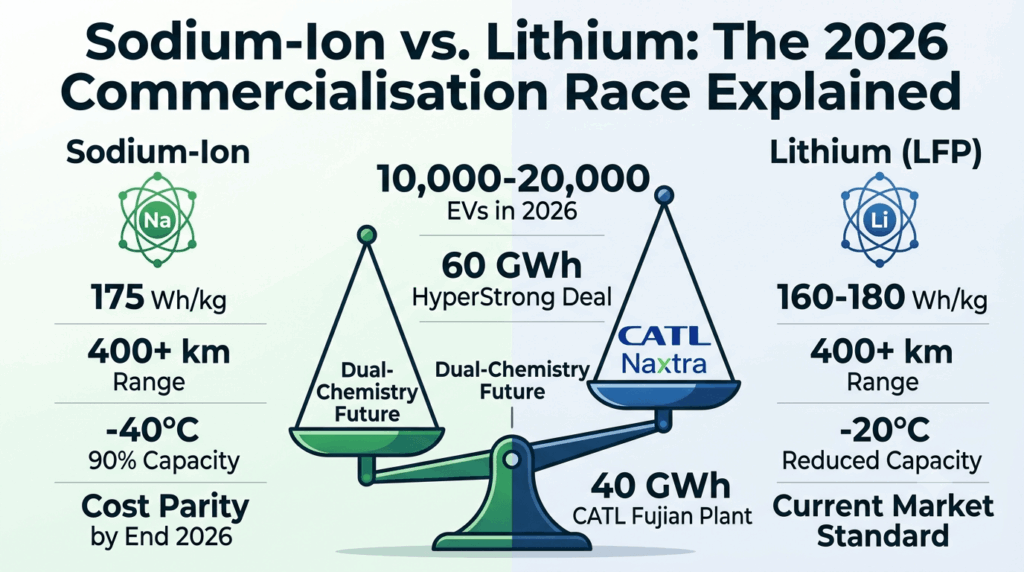
Sodium-ion vs. lithium: the 2026 commercialisation race explained - infographic comparing sodium-ion at 175 Wh/kg with 400+ km range and -40°C performance against LFP lithium-ion, with CATL Naxtra in mass production and 10,000 to 20,000 EVs equipped in 2026
Uncategorized

Sodium-Ion vs. Lithium: The 2026 Commercialisation Race Explained

Sodium-ion vs. lithium: the 2026 commercialisation race explained. CATL’s Naxtra battery is in mass production with 175 Wh/kg energy density. The Changan Nevo A06 is the first mass-production sodium-ion passenger vehicle. CATL forecasts cost parity with LFP by the end of 2026. This analysis breaks down the technology, the key players, the cost dynamics, the cold-weather advantage, the heavy-duty applications, and what the dual-chemistry future actually looks like.

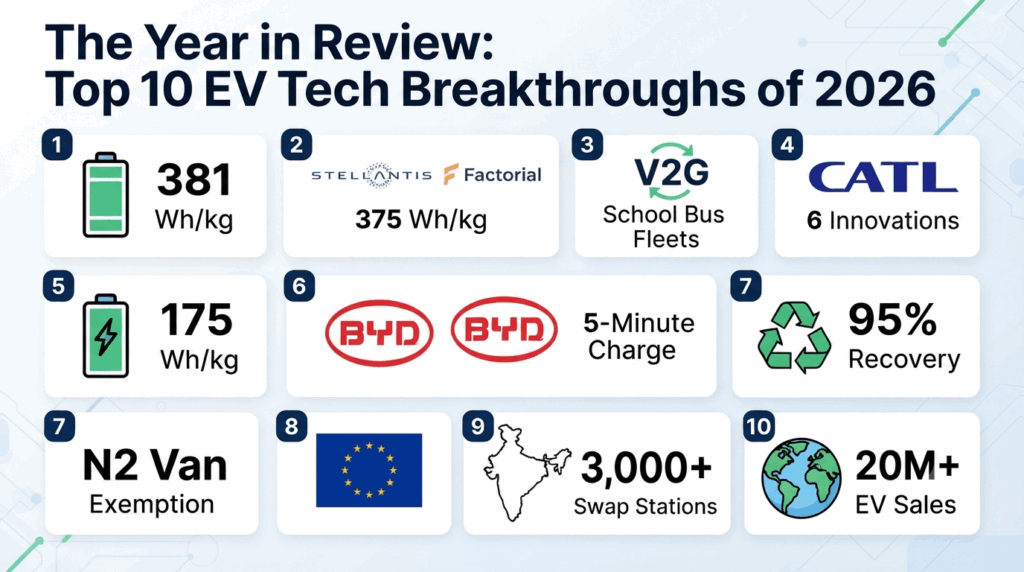
The year in review: top 10 EV tech breakthroughs of 2026 - infographic showing solid-state battery mass production at 381 Wh/kg, Stellantis Factorial road testing at 375 Wh/kg, V2G school bus fleets, CATL six innovations, sodium-ion at 175 Wh/kg, BYD five-minute charging, 95 percent battery recycling recovery, EU N2 van exemption, India 3,000+ swap stations, and 20 million global EV sales
EV charging

The Year in Review: Top 10 EV Tech Breakthroughs of 2026

The year in review: top 10 EV tech breakthroughs of 2026 is not a list of press releases. It is a list of technologies that actually shipped, scaled, or fundamentally changed what is possible. From ProLogium beginning mass production of solid-state batteries to Stellantis and Factorial launching North America’s first solid-state road test, from V2G going commercial with school bus fleets to CATL unveiling six innovations at Super Technology Day, from sodium-ion reaching commercial scale to BYD’s five-minute flash charging, from battery recycling becoming profitable to India’s battery swapping network reaching critical mass, this is the definitive recap of the technologies that shaped electric mobility in 2026.

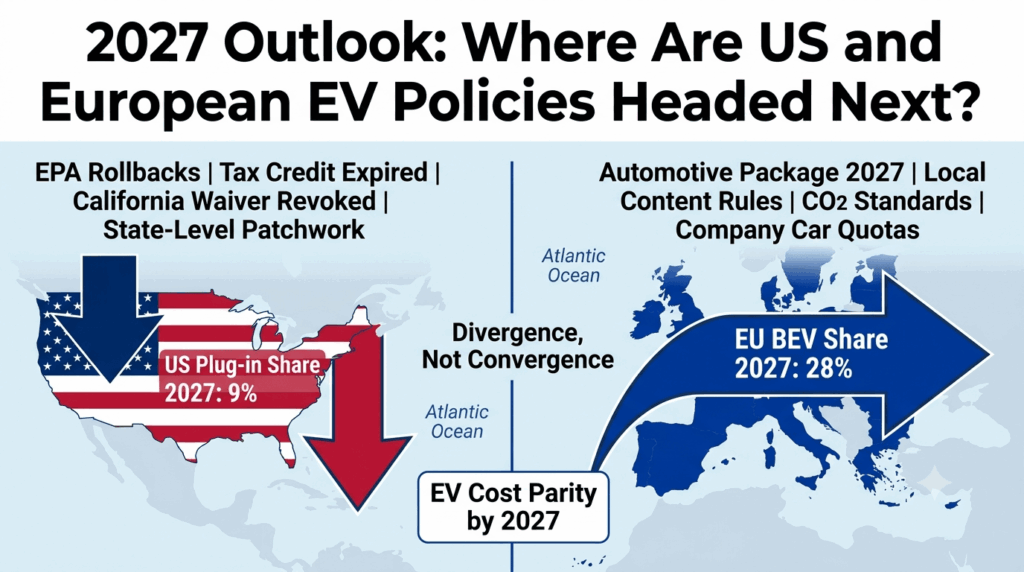
2027 outlook: where are US and European EV policies headed next? Infographic showing US policy withdrawal with EPA rollbacks and state-level resistance versus EU regulatory consolidation with local content rules and company car quotas, projecting 9 percent US plug-in share and 28 percent EU BEV share in 2027
EV charging

2027 Outlook: Where Are US and European EV Policies Headed Next?

The 2027 outlook for US and European EV policies points to divergence, not convergence. This analysis breaks down the EPA rollbacks and state-level resistance in the United States, the EU Automotive Package delay and local content rules, the cost convergence underway as battery prices fall, and what the next regulatory cycle actually means for manufacturers and buyers on both sides of the Atlantic.

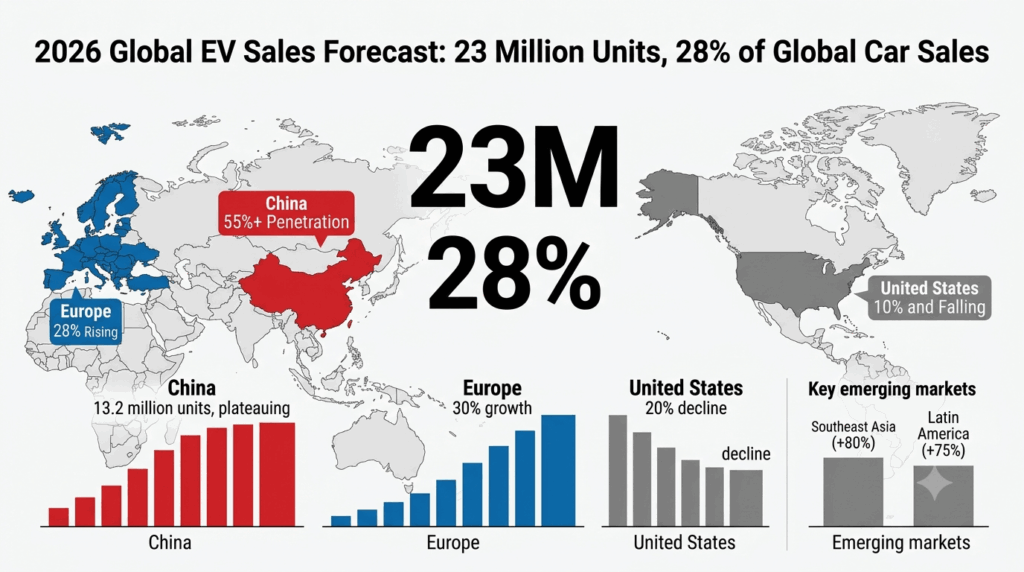
2026 global EV sales forecast: 23 million units, 28% of global car sales - infographic showing global EV sales reaching 23 million units and 28 percent market share, with China at 55 percent penetration, Europe at 28 percent, United States at 10 percent, and emerging markets growing 75 to 80 percent
EV charging

2026 Global EV Sales Forecast: 23 Million Units, 28% of Global Car Sales

The 2026 global EV sales forecast points to 23 million units and 28% of global car sales. This analysis breaks down the regional divergence behind the headline number: China approaching 60% market share, Europe growing 30% on regulatory momentum, the United States contracting 20% after losing federal tax credits, and emerging markets in Southeast Asia and Latin America surging 75% to 80%. It examines the energy security premium that has become the dominant purchase motivation, the supply chain concentration that underpins the forecast, and what the numbers actually mean for the future of global electric mobility.

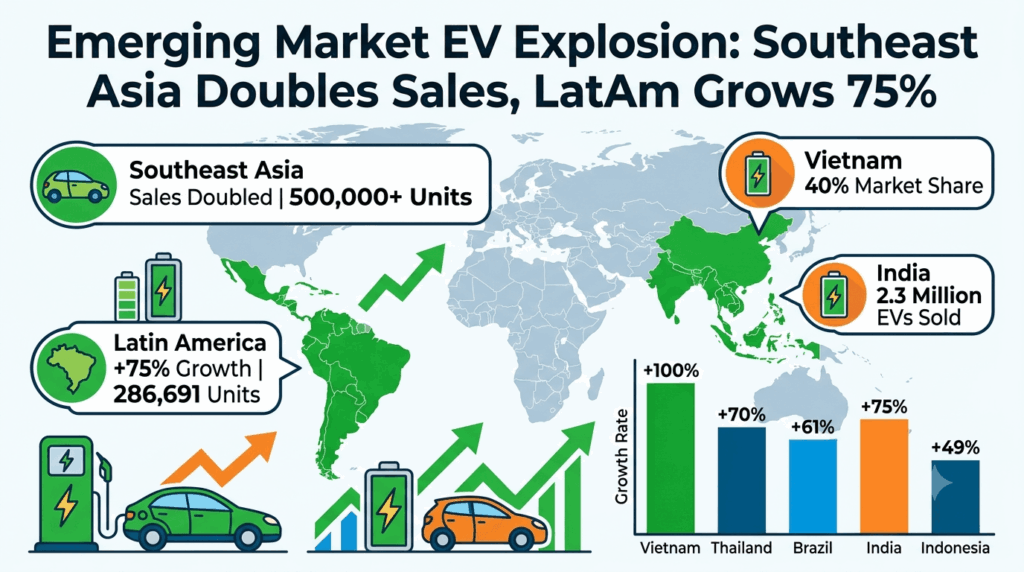
Emerging market EV explosion: Southeast Asia doubles sales, LatAm grows 75% — comparison chart showing Vietnam at 175,099 units, Thailand at 140,000, Indonesia at 100,000+, Brazil at 286,691, Mexico at 96,636, India at 2.3 million, and Colombia at 87,677 units
EV charging

Emerging Market EV Explosion: Southeast Asia Doubles Sales, LatAm Grows 75% — The Honest Complete Guide

Emerging market EV explosion: Southeast Asia doubles sales, LatAm grows 75% — and the data confirms that the Global South is no longer following in the EV transition. It is leading. This complete guide breaks down the record growth across emerging markets: Southeast Asia’s sales more than doubling to over half a million vehicles, Vietnam reaching nearly 40% market share, Thailand selling 140,000 EVs, Indonesia doubling to 15%, Latin America growing 75% with Brazil selling 286,691 electrified vehicles and Mexico reaching 96,636 units, and India hitting 2.3 million EV sales. It covers the policy drivers, the role of affordable Chinese models, the energy crisis catalyst, and what this means for the global automotive industry

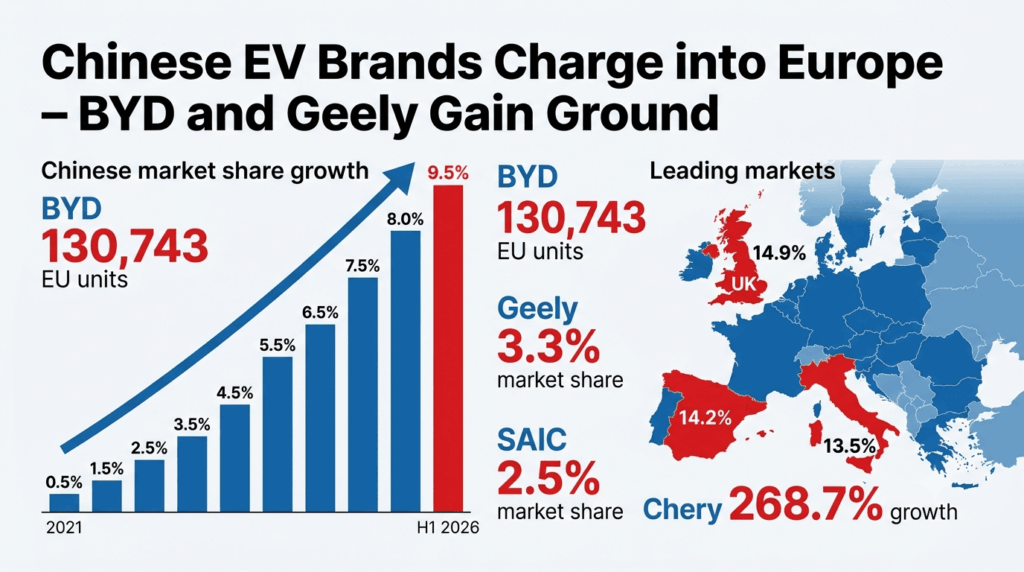
Chinese EV brands charge into Europe – BYD and Geely gain ground — infographic showing Chinese brands reaching 9.5% European market share in H1 2026, up from 0.5% in 2021, with BYD at 130,743 EU units and Geely at 3.3% market share
EV charging

Chinese EV Brands Charge into Europe – BYD and Geely Gain Ground: The Honest Complete Guide

Chinese EV brands charge into Europe – BYD and Geely gain ground — and the data confirms that the European automotive market is undergoing a structural realignment. This complete guide breaks down the combined 9% market share held by four major Chinese OEMs (BYD, Geely, SAIC, and Chery), BYD’s rise to become Europe’s bestselling Chinese brand (130,743 EU units in H1 2026), Geely’s quiet expansion through Volvo, Polestar, and Lynk & Co (3.3% market share), the EU tariff response and its PHEV loophole, the profitability challenges of the export model, and what this means for European consumers and the auto industry.

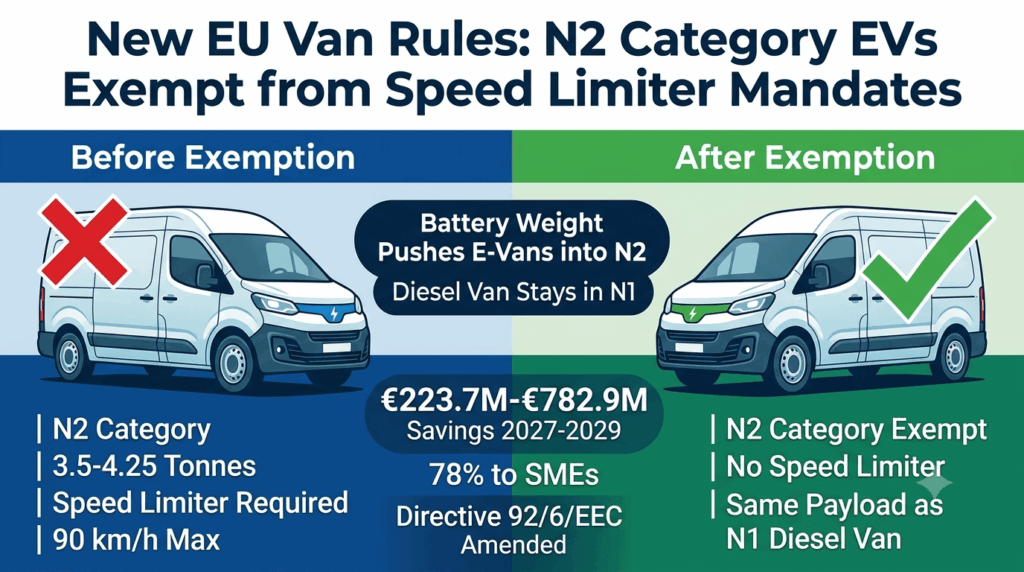
New EU van rules: N2 category EVs exempt from speed limiter mandates — infographic showing electric vans with battery weight pushed into N2 category facing 90 km/h speed limiter requirement, now exempt, with €782.9 million cumulative savings from 2027 to 2029 and 78 percent benefiting SMEs
EV charging

New EU Van Rules: N2 Category EVs Exempt from Speed Limiter Mandates — The Honest Complete Guide

New EU van rules: N2 category EVs exempt from speed limiter mandates — and the exemption represents a sensible correction to a regulatory anomaly that has been penalising electric vans for their own battery weight. This complete guide breaks down the specific legislative amendments to Directive 92/6/EEC and Regulation (EU) 2019/2144, the weight-based classification problem that pushed e-vans into N2 category, the estimated €223.7 million to €782.9 million in cumulative savings from 2027 to 2029, the road safety concerns raised by type-approval authorities, the EESC opinion and its recommendation for conditionality, and what this means for Europe’s rapidly growing electric van market.

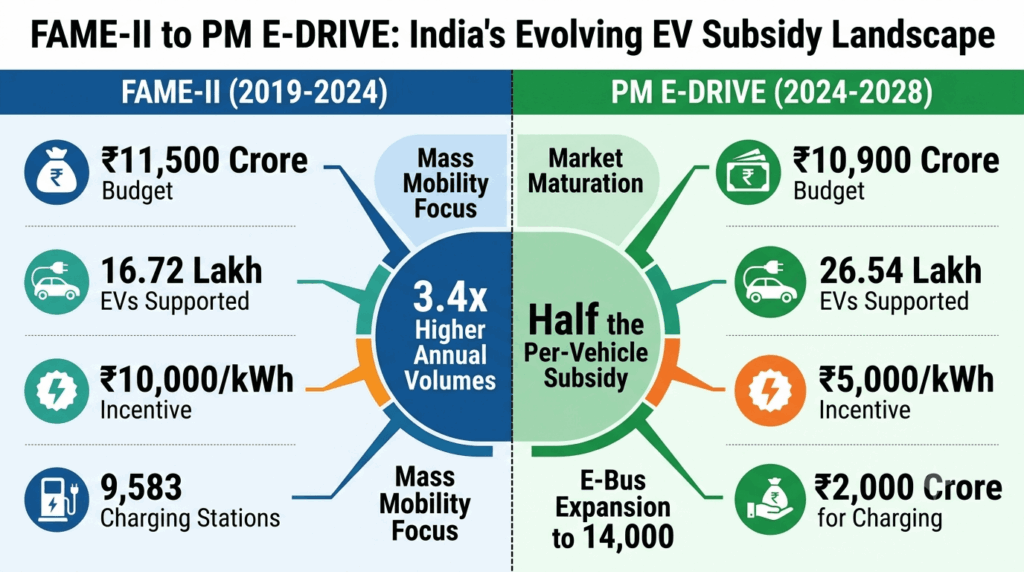
FAME-II to PM E-DRIVE: India's evolving EV subsidy landscape — infographic comparing FAME-II with ₹11,500 crore outlay and 16.72 lakh EVs supported against PM E-DRIVE with ₹10,900 crore and 26.54 lakh EVs supported, showing 3.4x higher annual volumes with half the subsidy
Uncategorized

FAME-II to PM E-DRIVE: India’s Evolving EV Subsidy Landscape — The Honest Complete Guide

FAME-II to PM E-DRIVE: India’s evolving EV subsidy landscape — and the data confirms that India’s EV subsidy framework has successfully transitioned from market activation to market consolidation. This complete guide breaks down the ₹11,500 crore FAME-II scheme (16.72 lakh EVs supported, 9,583 charging stations, ₹10,000/kWh incentive) and the ₹10,900 crore PM E-DRIVE scheme (26.54 lakh EVs supported, 3.4x higher annual volumes with half the subsidy, ₹2,000 crore for charging infrastructure), the CEEW study findings, the state-wise adoption patterns, and what this evolution means for India’s EV future.

Scroll to Top