The global electric vehicle market in 2025 was a tale of three regions — and the differences could not be more stark.
In Europe, EV sales surged by more than 30% (with some country-level growth reaching 36% and above), making it the fastest-growing major EV market in the world. In China, growth slowed slightly, with a decline of approximately 9% in certain periods, as a temporary halt to its trade-in scheme cooled the world’s largest EV market. In the United States, the picture was one of collapse — fourth-quarter sales plunged 45% year-on-year after the $7,500 federal tax credit expired.
US (-25%), Europe (+36%), China (-9%) — these three numbers tell the story of a global EV market that is more divided than ever. This guide provides the complete, honest comparison — the data behind each region’s performance, the policy decisions that drove the outcomes, and what it all means for the future of electric mobility.
The Big Picture — A Global Market of Contrasts
One Global Average, Three Very Different Stories
The global headline:
Electric car sales grew by 20% globally to exceed 20 million in 2025, meaning one-quarter of all new cars sold worldwide were electric. This marked the fifth consecutive year in which annual electric car sales increased by about 3.5 million.
The regional divergence:
The headline figure, however, masks a stark regional divide:
The 2026 outlook:
The IEA projects global electric car sales will reach 23 million in 2026, representing 28% of total car sales. But the regional trajectories are expected to remain divergent.
Europe (+36%) — The Comeback Story
How the European Market Surged to 4.2 Million Sales
The headline numbers:
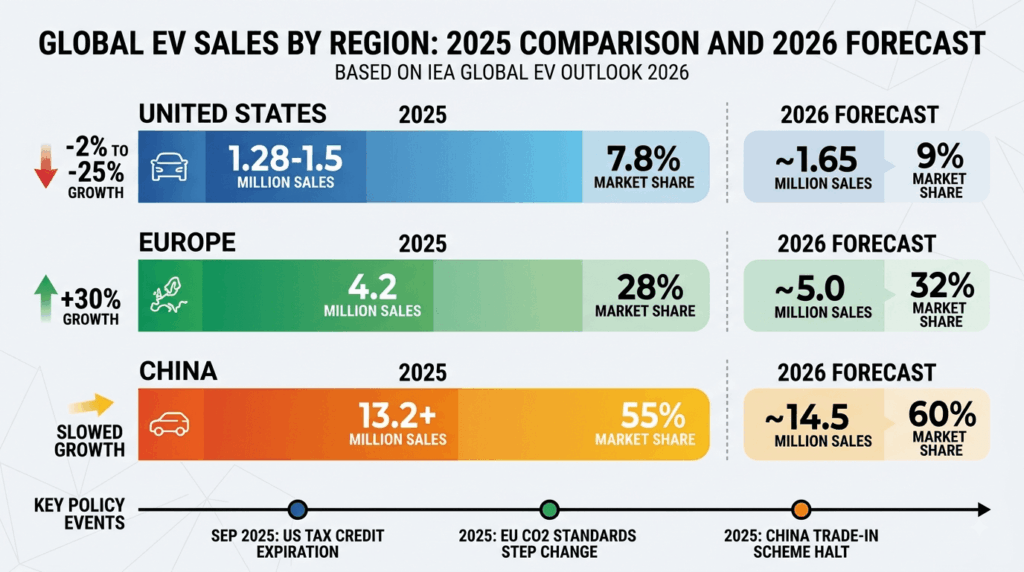
Europe experienced an upswing in sales following a step change in the EU CO₂ standards, with sales rising 30% to more than 4 million after having stagnated in 2024. Some estimates put the growth at over 36% in key markets, with European EV sales reaching approximately 4.2 million units, equivalent to 28% of total new car sales.
The policy driver:
The single most important factor behind Europe’s surge was the step change in the European Union’s CO₂ standards for cars. The entry into force of stricter emission limits in 2025 prompted manufacturers to offer cheaper models. The regulatory framework created a clear incentive for automakers to increase EV sales to meet fleet average CO₂ targets.
The country-level performers:
- Germany: The largest EV market in Europe, with sales increasing by 43.2% to 545,142 BEVs. The BEV market share reached 19.1%.
- Spain: BEV sales grew by 77.1%, one of the strongest growth rates in Europe.
- Italy: BEV sales grew by 44.2%.
The 2026 outlook:
Europe is poised for continued growth, with EV and plug-in hybrid sales expected to rise about 20% in 2026, accounting for one in three cars sold.
China (-9%) — A Temporary Slowdown or a Structural Shift?
Why the World’s Largest EV Market Cooled
The headline numbers:
Growth in China’s electric car sales slowed slightly, in part due to a temporary halt to its trade-in scheme, but EVs still accounted for nearly 55% of all car sales. More than 13 million electric cars were sold in China in 2025. Monthly electric car sales exceeded a 50% sales share in 11 out of 12 months of 2025.
The 9% decline in context:
The 9% figure reflects a slowdown in growth momentum rather than an absolute decline in sales volume. China’s new energy vehicle penetration rate fell from 55% at the end of 2025 to below 40% in February 2026. This was primarily driven by:
- Temporary halt to the trade-in scheme: The trade-in program that offered consumers 20,000 Chinese yuan (about $2,750) to trade in an older vehicle for a new EV was temporarily halted.
- Overall car market weakness: Total car sales in China fell more than 20% year-on-year in the first half of 2026.
- Policy recalibration: The phasing out of trade-in subsidies in some regions caused domestic sales to slow.
The underlying strength:
Despite the slowdown, China remains the engine of global EV growth. An estimated 44 million electric cars were on Chinese roads at the end of 2025, representing around 13% of the total car stock. Chinese automakers supplied 60% of global electric car sales in 2025. The EV sales share is expected to grow to more than 60% in 2026.
The 2026 outlook:
The IEA expects Chinese EV sales to stagnate in 2026 compared with 2025, the first such stall this decade. However, the share of EVs in total car sales is expected to continue rising as overall car sales decline.
The United States (-25%) — The Policy-Driven Collapse
How the $7,500 Tax Credit Expiration Devastated the Market
The headline numbers:
In the United States, electric car sales remained relatively stable at just under 10% of car sales for the full year, though the end of EV tax credits coincided with a drop in sales at the end of the year. The IEA reported that US EV sales in the final quarter of 2025 were around 45% lower than the same period a year earlier.
The BEV market share fell from an all-time high of 11.3% in September to just 5.9% in October — a more than 50% decline in one month. In November, BEV market share plummeted further to 5.1%. 2025 marked the first annual decline in EV registrations in at least a decade.
The policy trigger:
On September 30, 2025, the One Big Beautiful Bill Act eliminated the $7,500 federal EV tax credit. The Act also eliminated penalties for automakers that fail to meet fuel efficiency standards, making them less incentivized to sell EVs.
The Q3 rush and Q4 collapse:
The expiration of the EV tax credits in September pulled ahead many EV sales that would have occurred later. Buyers rushed to beat the deadline in the third quarter, then the market fell silent in the fourth.
Americans spent a record $31 billion on EVs in Q3 2025 — only for spending to collapse immediately after. In December 2025, EV registrations plunged 48% year-over-year.
The 2026 outlook:
The IEA projects US EV sales will decline by 20% in 2026. Cox Automotive estimates that EVs will make up just 8% of all new car sales in 2026.
The Three Regions Compared — A Side-by-Side Analysis
The Numbers That Define the Divide
The visual story:
- US (-25%): A policy-driven collapse. The removal of federal support caused a market that was artificially inflated to be artificially deflated.
- Europe (+36%): A policy-driven surge. Stricter CO₂ standards forced manufacturers to offer cheaper models, expanding the market.
- China (-9%): A policy-driven slowdown. The temporary halt of the trade-in scheme cooled a market that had been running hot.
The common thread:
In all three regions, policy was the decisive factor. EV adoption curves are shaped as much by tax credits, tariffs and charging policy as by the cars themselves.
The Global Context — Where the Rest of the World Stands
Emerging Markets Are Catching Up Fast
Southeast Asia:
In Southeast Asia, annual sales more than doubled to reach a sales share of nearly 20%, led by Viet Nam, Indonesia and Thailand.
Latin America:
In Latin America, sales grew by 75%, led by Brazil and Mexico.
The global reach:
More than 100 countries recorded electric car sales growth in 2025, and in one-third of these, they represented at least 10% of new car sales.
The China connection:
Some later-entry markets have seen rapid increases in electric car sales, thanks to the economies of scale and cost-competitiveness of Chinese-made electric cars.
What This Means for Today’s EV Buyers
The Practical Implications of the Regional Divergence
For US buyers:
The US market is in a deep slump, and the policy uncertainty that caused it shows no sign of resolution. However, this has created a buyer’s market. New EV inventory has ballooned to 130 days’ supply, forcing automakers to pile on incentives. Used EVs now average $34,821 — within just $1,300 of used gas vehicles. For buyers willing to navigate the market without federal support, there are opportunities.
For European buyers:
Europe’s EV market is the strongest it has ever been. One in three cars sold in 2026 is expected to be electric. Buyers have more choice, better prices, and stronger infrastructure than ever before. The running cost advantage of EVs is more compelling than ever, with annual fuel cost savings in the EU growing 35% compared to 2025 savings.
For global perspective:
The global EV transition is accelerating everywhere except America. US buyers should understand that they are operating in a market that is an outlier — not the norm. The policy decisions that have devastated the US market are not being replicated elsewhere.
Internal Links — Further Reading on Clean Energy Bazaar
The US (-25%), Europe (+36%), China (-9%) comparison guide connects to the EV market and policy guides on cleanenergybazaar.com.
For the US EV sales slump guide covering the American collapse in detail, our US EV sales slump 25% – policy uncertainty and the hybrid pivot guide covers the complete analysis. For the Europe’s EV sales surge guide covering the European comeback, our Europe’s EV sales surge 30% – how Germany, Spain, and Italy are leading the comeback guide covers the country-level performance. For the IEA Global EV Outlook 2026 summary covering the full global picture, our IEA Global EV Outlook 2026: 2025 sales hit 20M, capturing 25% of global car sales guide covers the flagship report in full. For the Europe focus guide covering the European solid-state developments, our Europe focus: Nissan Europe/Oxford/Gelion; Dongfeng’s planned mass production guide covers the battery technology race.
Final Thoughts
US (-25%), Europe (+36%), China (-9%) — these three numbers capture the state of the global EV market in 2025 more accurately than any single global statistic.
Europe surged. The EU CO₂ standards step change forced manufacturers to accelerate EV production and lower prices, creating the strongest growth among major markets. Germany, Spain, and Italy led the charge with double-digit growth rates. Europe’s EV market share reached 28%, and one in three cars sold in 2026 is expected to be electric.
China cooled. The temporary halt to the trade-in scheme slowed growth in the world’s largest EV market. But China still sold more than 13 million EVs — more than Europe and the US combined. The EV sales share remained at nearly 55%, and is expected to exceed 60% in 2026.
The United States collapsed. The expiration of the $7,500 federal tax credit triggered a market collapse that was as dramatic as it was predictable. BEV market share fell from 11.3% to 5.9% in one month. The fourth quarter saw sales crash 45% year-on-year. 2025 marked the first annual decline in EV registrations in at least a decade.
The honest verdict: the global EV transition is accelerating, but it is doing so unevenly. Europe is leading the charge among developed markets. China remains the dominant force. The United States is falling behind — a victim of its own policy choices.