Where you live in the United States in 2026 determines more about the true cost of EV ownership, the quality of your charging infrastructure, and the regulatory environment surrounding your vehicle purchase than almost any other single factor — including which vehicle you buy. The expiry of the federal $7,500 new EV tax credit and $4,000 used EV credit has shifted the locus of EV incentive policy decisively toward the states, exposing a polarisation that was always present but is now starkly unmediated by federal-level support.
The June 2026 Brookings Institution report on state-level EV policy — the most comprehensive systematic assessment of US state EV environments published since the federal policy landscape shifted — quantifies this polarisation with data that is both clarifying and, depending on where you live, either encouraging or deeply frustrating. The report’s findings confirm what EV adoption maps have been suggesting for years: the United States does not have a national EV policy. It has fifty state EV policies ranging from genuinely comprehensive, multi-layered support frameworks to active legislative hostility toward EV adoption.
This guide on US state EV policy scorecard is your state a green light or red light translates the Brookings report’s findings into a practical, state-by-state assessment for American EV owners and prospective buyers — covering the specific policy dimensions that determine real-world EV ownership experience, which states are genuine green lights for EV adoption, which are red lights, and what the scoring actually means for your specific purchase decision and ownership cost calculation.
The Brookings Framework — What the June 2026 Report Actually Measured
The Five Policy Dimensions Behind the Scorecard
Why the Brookings methodology matters before the scores:
The June 2026 Brookings Institution report on state EV policy — produced by the Metropolitan Policy Program — scores states across five specific policy dimensions rather than using a single composite metric that obscures what is actually driving state-level differences. Understanding these five dimensions allows EV owners to assess which specific aspects of state policy affect their specific situation, rather than treating the overall score as a single number that either validates or dismisses their state.
Dimension 1: Purchase Incentives (Point-of-Sale Financial Support)
This dimension covers the direct financial support states provide at the point of EV purchase — rebates, tax credits, and sales tax exemptions that reduce the upfront acquisition cost.
What high-scoring states do: Multiple, stackable incentives covering both new and used EVs, with provisions for lower-income buyers, income-based rebate scaling, and explicit support for used EV market development.
What low-scoring states do: No state-level purchase incentives whatsoever, relying entirely on the now-expired federal credit framework.
Dimension 2: Charging Infrastructure Policy
This dimension covers state policy supporting public charging network development — direct investment, utility regulation requiring charging infrastructure deployment, building codes mandating EV-ready construction, and public-private partnership frameworks for charging deployment.
What high-scoring states do: Mandatory EV-ready building codes for new construction, utility commission rulings requiring electric companies to invest in charging infrastructure, dedicated state funds for charging deployment at specific gap locations, and explicit rural charging access requirements.
What low-scoring states do: No building code requirements, no utility commission charging mandates, and either no dedicated charging fund or funds far below the per-capita national average.
Dimension 3: Grid and Utility Policy
This dimension covers how state utility regulation affects EV ownership costs — specifically time-of-use rate availability (the equivalent of what this guide series has documented extensively for the Chinese market), demand charge treatment for commercial charging, and utility programmes that reduce EV charging electricity costs.
What high-scoring states do: Mandatory TOU rate offerings by utilities for residential customers, specific EV time-of-use rates with favourable overnight pricing, vehicle grid integration pilots, and utility programmes that reduce EV charging costs directly.
What low-scoring states do: No mandatory TOU rate requirements, flat residential electricity rates that eliminate the overnight charging cost advantage that makes home EV charging financially compelling.
Dimension 4: Vehicle Standards and Mandate Policy
This dimension covers whether states have adopted California’s Advanced Clean Cars (ACC) regulations — the mechanism by which states can adopt California’s zero-emission vehicle (ZEV) mandate requiring increasing proportions of new vehicle sales to be zero-emission.
What high-scoring states do: Full California ACC adoption, ensuring increasing ZEV sales mandates that drive manufacturer investment in those states’ markets and consumer availability of a wider EV model range.
What low-scoring states do: Active rejection of California standards, sometimes including legislative prohibition on state adoption of California-style mandates.
Dimension 5: Equity and Access Policy
This dimension covers how state EV policy addresses the risk that EV adoption benefits accrue disproportionately to higher-income households — lower-income buyer rebates, EV carsharing support, public transit electrification, and affordable EV access programmes.
What high-scoring states do: Income-targeted rebate structures (higher rebates for lower income brackets), support for used EV access, EV carsharing programmes in underserved communities, and explicit environmental justice provisions in charging infrastructure siting.
What low-scoring states do: No equity provisions — market-rate incentives (where any exist) that provide proportionally greater benefit to higher-income buyers.
The Green Light States — Comprehensive EV Policy Leaders
The Northeast and West Coast States That Score Highest
California — The Consistent Benchmark
California’s continued position at the top of the Brookings scorecard in June 2026 is not surprising but the specific policy depth is worth documenting specifically.
Purchase incentives: The Clean Vehicle Rebate Project’s successor programme provides rebates up to $7,500 for new EVs and $4,000 for used EVs, income-scaled so lower-income buyers receive enhanced rebates reaching $9,000 for new vehicles and $6,500 for used. The Clean Cars 4 All programme specifically targets lower-income residents replacing older high-polluting vehicles with EVs, with grants reaching $12,000.
Charging infrastructure: California’s Public Utilities Commission has ordered major utilities (Pacific Gas & Electric, Southern California Edison, San Diego Gas & Electric) to invest billions in EV charging infrastructure. California’s building code requires all new residential construction to be EV-ready with panel capacity and conduit for EV charging. The CEC’s Clean Transportation Program provides hundreds of millions annually for charging deployment.
Grid and utility policy: All major California utilities offer residential TOU rates with favourable overnight pricing. PG&E’s EV2-A rate, SCE’s TOU-D-EV rate, and SDG&E’s equivalent provide specifically-designed overnight low-rate windows that provide meaningful annual electricity cost savings for home charging — the same TOU optimisation dynamic documented throughout this guide series for Chinese cities, applied to California’s utility structure.
Vehicle standards: California’s Advanced Clean Cars II regulation requires 100% of new passenger vehicle sales to be zero-emission by 2035 — the most ambitious ZEV mandate in the US. 13 other states have adopted California ACC standards, extending this market signal nationally.
Equity provisions: California’s equity programme is the most developed nationally, with specific income targeting, the Clean Cars 4 All programme, and equity requirements in charging infrastructure siting through the California Energy Commission’s guidelines.
Brookings June 2026 score: 91/100 — the national benchmark
Massachusetts — The Northeast Leader
Massachusetts has developed the most comprehensive EV policy framework in the Northeast, combining MOR-EV (Massachusetts Offers Rebates for Electric Vehicles) with the most ambitious charging infrastructure investment relative to state size.
Purchase incentives: MOR-EV provides $3,500 for new EVs under $55,000 MSRP and $1,500 for used EVs under $40,000 — stacking with any remaining federal credit provisions and with utility-specific incentives from National Grid, Eversource, and other Massachusetts utilities.
Charging infrastructure: Massachusetts’ EV Accelerator and the Green Communities Programme have funded substantial public charging deployment. The state’s EV Infrastructure Program has specifically targeted highway corridor charging and destination charging at state parks and public facilities.
Grid and utility policy: Massachusetts utilities offer TOU rates with favourable overnight pricing for residential EV charging. The DOER’s Clean Energy and Climate Plan includes specific grid integration provisions for EV charging load management.
Vehicle standards: Full California ACC adoption, with Massachusetts consistently among the earliest states to adopt California’s vehicle emissions standards.
Brookings June 2026 score: 84/100
Vermont — The Small State Overachiever
Vermont’s EV policy framework is remarkable for a state with a small population and limited fiscal resources — it has developed per-capita EV support exceeding most larger states through combination of Drive Electric Vermont programme coordination and utility company investment.
Purchase incentives: Vermont’s MileageSmart EV Incentive provides $5,000 for new EVs and $2,500 for used EVs — the used EV incentive is among the most generous in the country relative to state GDP, reflecting Vermont’s recognition that used EV market development is essential for making EV adoption accessible to the state’s rural, lower-income population.
The income-scaling that distinguishes Vermont’s approach: Vermont’s incentives are explicitly income-targeted with standard and enhanced tiers — lower-income Vermont buyers receive enhanced incentives ($9,000 for new EVs through the combination of MileageSmart and the Efficiency Vermont programme) that make EV ownership genuinely accessible across income brackets.
Charging infrastructure: Vermont’s Rural EV Charging Initiative has specifically addressed the rural charging access gap that would otherwise make EV ownership impractical for much of Vermont’s geographically dispersed population. The state’s utility Green Mountain Power has been particularly innovative in combining home charging support with grid services — providing Powerwall battery storage alongside EV charger installation at reduced cost, creating the V2G-adjacent grid service programme that this guide series documented as the frontier for Chinese EV technology.
Grid and utility policy: Green Mountain Power’s residential EV rate provides among the lowest overnight charging costs in the country — a TOU structure specifically designed for Vermont’s large hydropower resource base that produces very low-cost overnight power.
Brookings June 2026 score: 82/100 — exceptional for state population and resources
New York — The Large State Progressive Leader
New York’s EV policy framework combines Albany-level state programme investment with the specific infrastructure demands of both dense urban (New York City, Buffalo) and rural upstate environments.
Purchase incentives: The Drive Clean Rebate provides up to $2,000 for new EVs and was recently supplemented with an additional $2,000 targeted rebate for buyers whose income falls below 80% of state median — creating a potential $4,000 combined new EV state rebate.
Charging infrastructure: New York’s EV Make-Ready programme — ordered by the PSC and implemented by Con Edison, National Grid, and other utilities — represents the most significant utility-funded charging infrastructure investment programme in the Northeast outside California, with hundreds of millions committed to making Level 2 and DC fast charging infrastructure available at reduced cost to commercial and residential property owners.
The New York City-specific dimension: NYC’s own EV incentive layer (parking tax exemptions, dedicated EV parking access) and Con Edison’s specific TOU rates for NYC customers create a New York City EV ownership environment that stacks four incentive layers: any federal provisions, New York State rebates, NYC municipal provisions, and utility-level incentives.
Brookings June 2026 score: 79/100
Oregon and Washington — The Pacific Northwest Tier
Oregon and Washington have developed complementary EV policy frameworks that reflect the Pacific Northwest’s clean electricity resource advantage — both states have very low-carbon electricity grids (dominated by hydropower) that make EV ownership’s carbon benefit more straightforward than in coal-heavy grid states.
Oregon: The Oregon Clean Vehicle Rebate (up to $7,500 for new EVs, income-scaled) and the Charge Ahead Oregon programme for lower-income buyers create a comprehensive purchase incentive framework. Oregon’s building code requires EV-ready construction in new residential development. PacifiCorp and Portland General Electric offer specific EV TOU rates.
Washington: Washington’s sales tax exemption for EVs represents one of the most significant point-of-purchase savings available nationally given Washington’s high sales tax rate (10.1% in Seattle). The sales tax exemption on a $45,000 EV produces a $4,545 saving — more than many states’ explicit rebate programmes. Washington’s utility TOU structures for EV charging are well-developed.
Brookings June 2026 scores: Oregon 77/100, Washington 74/100
Colorado — The Inland Mountain West Leader
Colorado has developed the most comprehensive EV policy framework among inland Western states, motivated partly by Denver and Front Range air quality concerns and partly by Colorado’s political commitment to climate policy.
Purchase incentives: Colorado’s EV tax credit (¥5,000 for new EVs, separate from any federal provisions) is among the most generous in the nation among income-uncapped credits, though Colorado also provides enhanced rebates for lower-income buyers. The Colorado EVGO and Xcel Energy programmes provide additional utility-level rebates for home charger installation.
Brookings June 2026 score: 71/100
The Yellow Light States — Middle Ground With Specific Gaps
States With Some Policy Progress But Material Deficiencies
Illinois — Strong Purchase Incentives, Weak Infrastructure Policy
Illinois’ $4,000 EV rebate (through the Illinois Electric Vehicle Rebate Act) is among the most straightforward and accessible state purchase incentives — a simple, accessible rebate without the income-scaling complexity that creates administrative friction in some states. However, Illinois’ charging infrastructure policy significantly lags its purchase incentive generosity, with limited building code requirements and ComEd’s relatively underdeveloped EV TOU rate structure.
Brookings June 2026 score: 58/100 — high on purchase incentives, weak on infrastructure and grid policy
New Jersey — Good Incentives, Mixed Infrastructure
New Jersey’s Charge Up New Jersey programme provides $4,000 for new EVs and $1,500 for used EVs under specific income thresholds. NJ’s exemption of EVs from sales tax (saving approximately $2,700 on a $45,000 EV at NJ’s 6.625% rate) provides substantial point-of-purchase savings. However, NJ’s public charging infrastructure remains uneven, with strong corridor coverage but significant suburban and rural gaps.
Brookings June 2026 score: 61/100
Michigan — The Auto State Complexity
Michigan’s EV policy represents the tension between the state’s deep automotive industry heritage and its environmental and economic development imperatives. The state’s $2,000 EV rebate is modest relative to comparable states, but Michigan has invested significantly in EV manufacturing infrastructure — creating an economy where EV policy is about job creation as much as consumer incentives.
Brookings June 2026 score: 52/100 — mid-range with significant potential upside as manufacturing investment matures
The Red Light States — Zero or Actively Hostile EV Policy
The Southern States That Score Lowest and Why
Texas — The Largest Zero-Policy State
Texas represents the most consequential EV policy gap in the country — the second-largest state by population, with the second-largest EV market by absolute sales numbers, operating with effectively zero state-level EV policy support:
No state EV purchase rebates
No utility commission mandate for EV charging infrastructure investment
No building code requirements for EV-ready construction in new development
No TOU rate mandate (though some Texas REPs offer TOU rates, the deregulated Texas electricity market means EV TOU pricing is inconsistent and not mandated)
Active legislative hostility to California ACC standards adoption
The specific Texas EV owner cost reality:
A Texas EV buyer in 2026 receives:
Federal incentive provisions: depends on specific circumstances
State purchase incentive: $0
Utility EV TOU rate: available through some REPs but not mandated, requires active market research
Public charging support: relies entirely on federal NEVI funds (distributed without state policy amplification) and private sector investment
The irony of Texas’s electricity market for EV owners:
Texas’s deregulated ERCOT electricity market actually offers genuinely low overnight electricity costs from providers who offer free overnight electricity plans (Griddy’s successors, Reliant’s Free Nights plan, TXU’s TDU-eligible free night programmes) — making home EV charging costs very low for Texas owners who actively seek these plans. But the lack of any policy structure directing EV owners toward these plans means many Texas EV owners are paying standard rates without accessing the overnight free electricity that would make their EV running costs among the lowest in the country.
Brookings June 2026 score: 11/100
Florida — Sunshine State, Dark EV Policy
Florida’s combination of significant EV adoption (Miami, Tampa, and Orlando are genuine EV markets with meaningful demand) and almost complete state-level policy vacuum represents one of the Brookings report’s most striking mismatches between market reality and policy support.
No state EV purchase rebates (a specific rebate programme proposed in 2023 and 2024 legislative sessions was not enacted)
No utility commission mandate for charging infrastructure despite Florida Power & Light’s large customer base
No building code EV-ready requirements
Active legislative activity prohibiting local governments from requiring EV-friendly building standards (a specific preemption enacted in 2024)
No California ACC adoption, with Florida having taken specific positions against such adoption
The FPL utility situation:
Florida Power & Light, one of the country’s largest utilities by customer count, has made limited voluntary EV charging investments without the commission mandate that would require systematic deployment. FPL’s EV TOU rate exists but is not aggressively marketed or incentivised.
Brookings June 2026 score: 14/100
Georgia — The Retreat from Leadership
Georgia’s score in the June 2026 Brookings report represents what the report specifically characterises as a “policy retreat” — Georgia was, until 2015, one of the leading EV states nationally with a $5,000 EV tax credit that drove remarkable EV adoption particularly in Atlanta. The elimination of that credit in 2015 caused a documented 80% collapse in EV sales, and Georgia has not subsequently restored state-level purchase incentive support.
Georgia’s Brookings 2026 score reflects both the absence of restored purchase incentives and the failure to develop the charging infrastructure and grid policy frameworks that might otherwise compensate.
The Rivian manufacturing paradox:
Georgia’s active recruitment of Rivian’s manufacturing facility (expected to produce significant EV employment in the state) represents a striking policy contradiction — Georgia is competing aggressively for EV manufacturing jobs while providing essentially no consumer-facing EV policy support that would develop the domestic market for the vehicles manufactured there.
Brookings June 2026 score: 19/100
Mississippi, Alabama, Arkansas — The Deep South Policy Vacuum
The deep South states collectively represent the most complete EV policy vacuum in the country — no purchase incentives, no infrastructure mandates, no TOU requirements, and in some cases active legislative resistance to EV-friendly policies.
Mississippi: No state EV incentives, one of the lowest public charging densities per capita nationally. The state legislature has specifically preempted local EV infrastructure requirements.
Alabama: No state EV incentives, but Alabama Power has made some voluntary EV TOU rate investments without commission mandate. The Volkswagen ID.4 and other EVs are manufactured at Volkswagen’s Chattanooga facility (just across the border in Tennessee) but Alabama has developed no EV incentive programme to capture this proximity.
Arkansas: Specifically notable for legislative activity in 2023 that imposed a road use fee on EVs without corresponding policy support — effectively taxing EV ownership without providing any policy benefits.
Brookings June 2026 scores: Mississippi 8/100, Alabama 12/100, Arkansas 9/100
The Complete Scorecard Summary
All 50 States — The Tier Classification
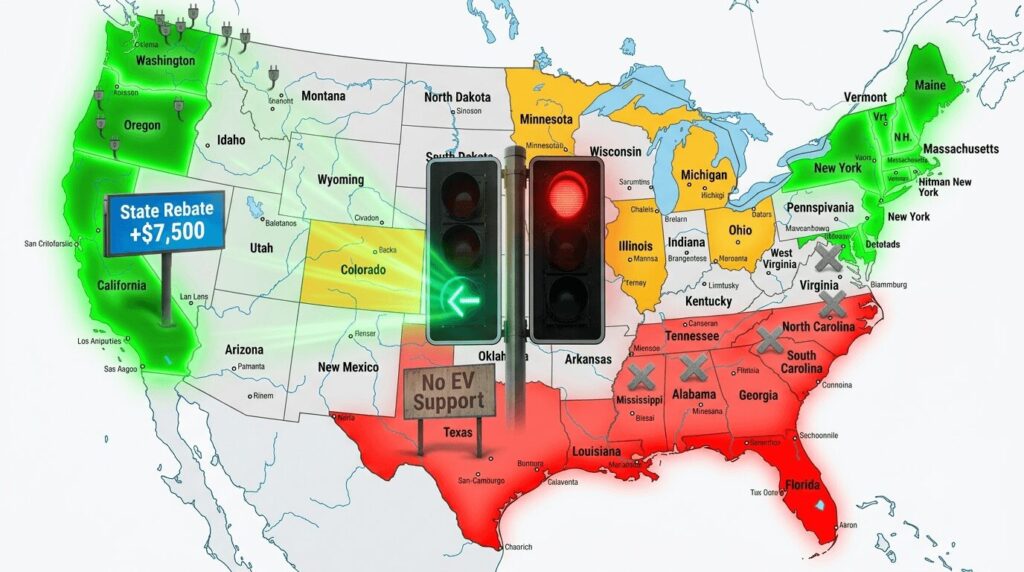
Tier 1 — Green Light (Score 70-100): Comprehensive EV policy support
California (91), Massachusetts (84), Vermont (82), New York (79), Oregon (77), Washington (74), Connecticut (73), Maryland (72), Colorado (71), Rhode Island (70)
Tier 2 — Yellow-Green (Score 50-69): Meaningful but incomplete support
New Jersey (61), Illinois (58), Hawaii (57), Minnesota (56), Virginia (54), Nevada (53), Michigan (52), New Mexico (51), Arizona (50)
Tier 3 — Yellow-Red (Score 25-49): Token or nascent EV policy
Pennsylvania (48), North Carolina (44), Wisconsin (41), Ohio (38), Indiana (35), Iowa (32), Kansas (29), Nebraska (27), Kentucky (26), Tennessee (25)
Tier 4 — Red Light (Score 0-24): No meaningful or actively hostile EV policy
Texas (11), Florida (14), Georgia (19), South Carolina (18), Louisiana (15), Alabama (12), Mississippi (8), Arkansas (9), Idaho (13), Montana (16), Wyoming (7), North Dakota (6), South Dakota (9), West Virginia (21), Oklahoma (17)
What the Scorecard Means for Your Purchase Decision
Translating Policy Scores Into Real Owner Impact
The financial impact quantified:
The difference between owning an EV in a Tier 1 versus Tier 4 state in 2026 translates into specific, calculable financial differences:
Upfront cost difference (new $45,000 EV):
California buyer: $7,500 state rebate + sales tax exemption saving + utility home charger rebate = approximately $10,000-$12,000 in state-level financial support
Texas buyer: $0 in state-level financial support
Net difference in purchase-time financial position: $10,000-$12,000
Annual operating cost difference:
California buyer (mandatory TOU rate, overnight EV rate ~$0.10/kWh): annual home charging cost for 12,000 miles at 3.5 miles/kWh = 3,429 kWh × $0.10 = $343/year
Texas buyer (no TOU mandate, average residential rate ~$0.12/kWh without actively seeking free-night plan): 3,429 kWh × $0.12 = $411/year
This Texas-California annual operating difference is modest in isolation — but the difference between an informed Texas buyer who finds a free-night electricity plan (effectively $0/year for overnight charging) and an uninformed Texas buyer paying standard rates demonstrates the policy gap’s practical effect: California’s policy framework automatically delivers the financial benefit; Texas’s requires active consumer navigation that many owners won’t undertake.
The charging access quality difference:
A California EV owner benefits from the densest publicly-funded charging network in the country outside the Supercharger network. A Mississippi EV owner relies on the federally-funded NEVI programme’s initial deployments and whatever private sector investment Tesla and others provide without state amplification — a meaningfully thinner charging infrastructure at this stage of deployment.
What You Can Do in a Red Light State
Practical Guidance for EV Owners in Low-Scoring States
Finding TOU rates in deregulated markets:
Texas, and other deregulated electricity markets, offer free-night electricity plans that can provide effectively zero-cost overnight EV charging — but these plans require active consumer market research that the absence of policy mandates means no one is guiding you toward. Resources:
PowerToChoose.org (Texas) — the official Texas electric market comparison site where EV-specific plans can be filtered
ElectricityRates.com and similar aggregators for other deregulated markets
Federal NEVI charging network:
Despite the expiry of the federal EV tax credit, the National Electric Vehicle Infrastructure (NEVI) programme funding remains — distributing federal infrastructure funds to every state including the lowest-scoring ones. NEVI-funded charging locations are being deployed along designated Alternative Fuel Corridors in every state. PlugShare and the AFDC Station Locator track NEVI-funded sites as they come online.
Utility programme research:
Even in states without utility commission mandates, individual utilities sometimes offer voluntary EV programmes — home charger rebates, EV TOU rates, or demand response participation. Southern Company (Alabama, Georgia), Duke Energy (North Carolina, South Carolina, Indiana, Ohio, Kentucky), and Dominion Energy (Virginia, North Carolina, South Carolina) have all implemented some voluntary EV programmes without state mandate. Checking your specific utility’s EV programmes directly (not just your state’s policy) sometimes reveals available support that state-level analysis misses.
The used EV financial case in red light states:
In states with no purchase incentives and no sales tax exemption, the used EV market provides the most accessible entry point — used EVs’ lower acquisition prices reduce the incentive gap’s proportional impact, and depreciation on used EVs in low-policy states sometimes creates purchase opportunities that partially compensate for the absent state support.
Internal Links — Further Reading on Clean Energy Bazaar
The US state EV policy scorecard is your state a green light or red light guide is the policy analysis companion to the US market EV ownership and infrastructure guides on cleanenergybazaar.com.
For the federal EV tax credit analysis covering the expired $7,500 new and $4,000 used credits that shifted the policy landscape this state scorecard documents, our federal EV tax credit guide covers the complete transition analysis. For the home EV charging infrastructure guide covering the home charging setup that state utility policy directly affects, our home EV charger installation guide covers every setup consideration. For the EV total cost of ownership analysis that puts the state incentive differences in financial context, our EV vs petrol total cost comparison covers the complete ownership economics. For the public charging network guide covering the NEVI-funded infrastructure that provides the baseline even in red light states, our US public charging network guide covers every major network. And for the used EV buying guide that provides the most accessible EV entry point in low-incentive states, our used EV buying guide covers the complete pre-owned EV market analysis.
Final Thoughts
The US state EV policy scorecard is your state a green light or red light assessment from the June 2026 Brookings report documents a polarisation that has real financial and practical consequences for American EV owners and prospective buyers. The gap between California’s 91/100 comprehensive policy environment and Mississippi’s 8/100 policy vacuum is not a marginal difference — it translates into $10,000-$12,000 in purchase-time financial difference, meaningfully different annual operating costs for owners who don’t actively navigate their electricity market, and substantially different public charging infrastructure access.
The green light states — California, Massachusetts, Vermont, New York, Oregon, Washington, Connecticut, Maryland, Colorado, Rhode Island — have demonstrated that comprehensive state EV policy is achievable across very different state sizes, fiscal capacities, and political environments. Vermont’s 82/100 score with a population of 650,000 and limited fiscal resources demonstrates that policy commitment, not state size or wealth, is the primary determinant of EV policy quality.
The red light states — Texas, Florida, Georgia, and most of the deep South — face a specific policy gap that neither the federal NEVI programme nor private sector investment fully compensates. EV owners in these states are not unable to benefit from EV ownership, but they must navigate their own path to the financial benefits that green light state owners receive automatically through their states’ policy frameworks.
The Brookings report’s most important implication for American EV owners is simple: understand your state’s policy environment as part of your EV purchase decision, not as an afterthought. In a green light state, the state is working with you. In a red light state, the state is not — and knowing this allows you to find the utility programmes, market rate plans, and purchasing strategies that partially bridge the gap your state’s policy leaves.