Here is the number most Chinese EV owners get wrong — not because it is complicated but because they have never calculated it precisely.
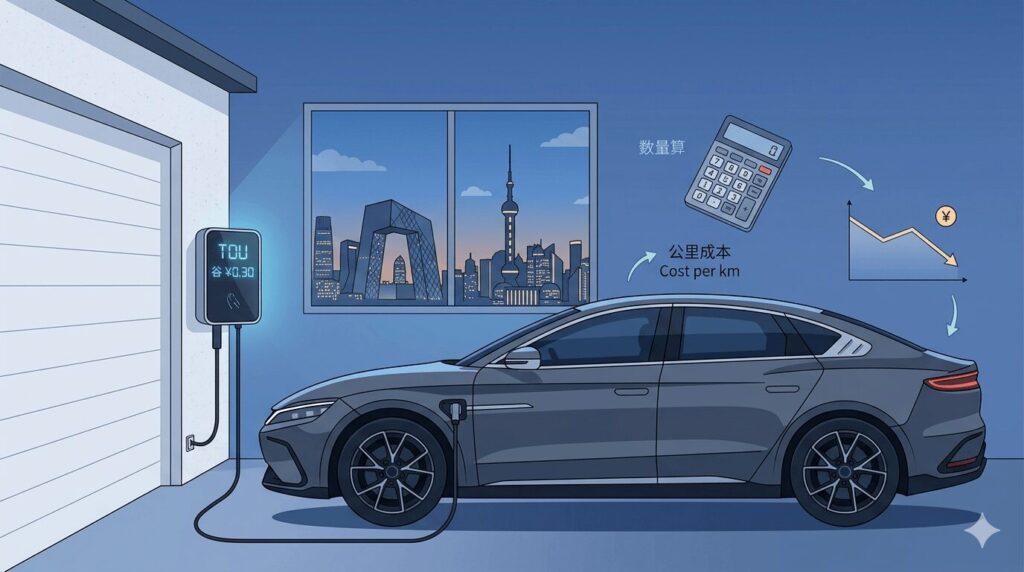
The cost per kilometre of home EV charging.
Most EV owners know they pay less than petrol. Most know they charge at valley rates overnight. But the specific per-kilometre cost — which changes with every city’s TOU tariff structure, every vehicle’s efficiency, and every owner’s mixture of peak, flat, and valley rate charging — is something almost nobody has calculated for their exact situation.
This matters beyond curiosity. The per-kilometre electricity cost is the foundation of every home EV charger ROI calculation, every comparison with public DC charging, and every argument for or against the annual electricity saving from TOU optimisation. Getting it wrong — using a Shanghai rate for a Beijing owner, or assuming full valley rate charging when the actual mix includes some flat-rate sessions — understates or overstates the financial case by ¥500-¥2,000 per year.
This guide on the home EV charging cost calculator factor in tiered electricity rates Beijing vs Shanghai provides the interactive calculator that gets this number exactly right for your specific combination of city, vehicle, mileage, and charging behaviour — plus the complete reference tables, methodology explanations, and city-by-city cost comparisons that contextualise your result within China’s broader electricity pricing landscape.
Understanding China’s Tiered Electricity Rate Structure
The Two Layering Systems — Tiered Pricing and TOU Pricing
Chinese residential electricity pricing combines two separate pricing mechanisms that interact to produce the actual rate any household pays for any unit of electricity.
Mechanism 1: Tiered Volume Pricing (阶梯电价)
China’s tiered volume pricing divides annual electricity consumption into three tiers — with higher tiers priced at premium rates:
| Tier | Annual consumption | Rate premium |
|---|---|---|
| Tier 1 (第一档) | First 2,760 kWh/year | Base rate |
| Tier 2 (第二档) | 2,761-4,800 kWh/year | +0.05 ¥/kWh |
| Tier 3 (第三档) | Above 4,800 kWh/year | +0.30 ¥/kWh |
The EV owner implication:
A Chinese household’s annual electricity consumption without an EV: approximately 1,500-3,500 kWh. Adding an EV (3,000-5,000 kWh annual charging) pushes most households into higher tiers.
However — the dedicated EV meter solution:
As established throughout this guide series, Chinese home EV charging installations include a separate dedicated meter for EV electricity. This dedicated meter has its own tier calculation — separate from the household meter. The EV’s annual consumption doesn’t push the household into a higher tier, and the EV consumption tier calculation starts from zero independently.
For EV owners with dedicated meters (the standard installation): The tiered pricing impact on EV charging is minimal — the EV meter rarely exceeds Tier 1 or early Tier 2 on the dedicated meter’s separate calculation.
Mechanism 2: Time-of-Use Pricing (居民分时电价)
As covered in our TOU savings guide, three time periods have different electricity rates: peak (峰), flat (平), and valley (谷).
The interaction between tiered and TOU pricing:
In most Chinese cities, TOU pricing and tiered pricing operate on the dedicated EV meter simultaneously. The combined rate for any charging session is: Tier rate × TOU multiplier.
In practice, because EV dedicated meters start their tier calculation fresh and most EV owners don’t exceed 4,800 kWh on the dedicated meter alone, most EV owners pay Tier 1 rates × TOU multipliers — making the effective rate simply the TOU rate as published.
The Interactive Home EV Charging Cost Calculator
The calculator below takes your city, vehicle, annual mileage, and charging behaviour to produce precise annual electricity costs, per-kilometre rates, and comparisons with petrol and public DC charging.
Home EV charging cost calculator — China tiered TOU rates, Beijing Shanghai & major cities
How to use the calculator:
Select your city from the dropdown — covering Beijing, Shanghai, Shenzhen, Guangzhou, Chengdu, Hangzhou, Wuhan, Nanjing, Xi’an, Harbin, and a tier-2 city average. Select your vehicle (or enter custom efficiency). Set your annual mileage and adjust the three charging mix sliders to reflect your actual behaviour — what percentage of your charging happens at valley, flat, and peak rates. Set the public DC fast charging rate you pay when you use public stations.
The Summary tab shows your annual electricity cost, effective blended rate, cost per kilometre, and annual savings versus petrol and public DC. The Rate Breakdown tab shows the full TOU structure for your city and your cost per km at each rate. The Annual Comparison tab shows the bar chart comparison across all charging methods.
The Complete City-by-City Cost Reference
The calculator handles individual scenarios. These reference tables provide the complete picture for every major Chinese EV market.
Annual Electricity Cost by City — BYD Han EV Long Range, 20,000 km/year
All calculations assume 85% valley rate charging, 10% flat rate, 5% peak rate — representing a diligent TOU scheduler with occasional non-valley charging.
| City | Valley Rate | Flat Rate | Peak Rate | Annual kWh | Annual Cost | Cost/km |
|---|---|---|---|---|---|---|
| Beijing | ¥0.30 | ¥0.65 | ¥0.85 | 4,074 | ¥1,278 | ¥0.064 |
| Chengdu | ¥0.25 | ¥0.55 | ¥0.70 | 4,074 | ¥1,062 | ¥0.053 |
| Hangzhou | ¥0.28 | ¥0.55 | ¥0.75 | 4,074 | ¥1,177 | ¥0.059 |
| Shenzhen | ¥0.33 | ¥0.58 | ¥0.78 | 4,074 | ¥1,388 | ¥0.069 |
| Wuhan | ¥0.31 | ¥0.56 | ¥0.76 | 4,074 | ¥1,304 | ¥0.065 |
| Guangzhou | ¥0.32 | ¥0.55 | ¥0.75 | 4,074 | ¥1,347 | ¥0.067 |
| Shanghai | ¥0.34 | ¥0.67 | ¥0.87 | 4,074 | ¥1,437 | ¥0.072 |
| Nanjing | ¥0.33 | ¥0.60 | ¥0.80 | 4,074 | ¥1,390 | ¥0.069 |
| Xi’an | ¥0.32 | ¥0.57 | ¥0.75 | 4,074 | ¥1,352 | ¥0.068 |
| Harbin | ¥0.33 | ¥0.63 | ¥0.82 | 4,074 | ¥1,403 | ¥0.070 |
The Chengdu finding: Despite having lower absolute TOU savings than Beijing (lower rate differential between peak and valley), Chengdu produces the lowest absolute annual electricity cost of any major Chinese city — ¥1,062/year for 20,000 km. This is the direct result of Sichuan’s abundant hydropower driving valley rates to ¥0.25/kWh — the lowest of any major Chinese EV market.
The Beijing-Shanghai comparison:
Beijing: ¥1,278/year (¥0.064/km)
Shanghai: ¥1,437/year (¥0.072/km)
Beijing costs ¥159/year less than Shanghai despite having a higher peak rate — because Beijing’s valley rate (¥0.30) is lower than Shanghai’s (¥0.34) and the majority of charging happens at valley rates.
The Charging Mix Sensitivity Analysis
How much does changing your charging behaviour affect annual cost? This table shows the annual electricity cost for a BYD Han EV Long Range owner in Shanghai at different charging mixes.
| Charging mix | Annual cost | Cost/km | vs 100% valley |
|---|---|---|---|
| 100% valley (¥0.34) | ¥1,385 | ¥0.069 | baseline |
| 90% valley, 10% flat | ¥1,493 | ¥0.075 | +¥108 |
| 85% valley, 10% flat, 5% peak | ¥1,537 | ¥0.077 | +¥152 |
| 70% valley, 20% flat, 10% peak | ¥1,759 | ¥0.088 | +¥374 |
| 50% valley, 40% flat, 10% peak | ¥2,093 | ¥0.105 | +¥708 |
| 0% valley, 100% flat | ¥2,729 | ¥0.136 | +¥1,344 |
| 0% valley, 50% flat, 50% peak | ¥3,056 | ¥0.153 | +¥1,671 |
The cost of imperfect TOU adherence:
Moving from 85% valley / 10% flat / 5% peak (realistic diligent TOU user) to 70% valley / 20% flat / 10% peak (moderate TOU adherence) costs ¥222/year more. This is real money but modest — the vast majority of TOU value is captured even with imperfect adherence.
The truly expensive scenario is 0% valley charging — paying ¥3,056/year versus ¥1,385/year. The ¥1,671/year gap represents the maximum TOU saving available.
Vehicle Efficiency Comparison — Shanghai TOU, 20,000 km/year, 85% Valley
| Vehicle | Real-world eff | Annual kWh | Annual TOU cost | Cost/km | vs petrol (¥/km) |
|---|---|---|---|---|---|
| Wuling Mini EV | 12 kWh/100km | 2,691 | ¥914 | ¥0.046 | ¥0.580 saving |
| BYD Dolphin | 14 kWh/100km | 3,138 | ¥1,067 | ¥0.053 | ¥0.572 saving |
| BYD Han EV Standard | 17 kWh/100km | 3,810 | ¥1,295 | ¥0.065 | ¥0.561 saving |
| BYD Han EV Long Range | 18 kWh/100km | 4,034 | ¥1,372 | ¥0.069 | ¥0.557 saving |
| NIO ET5 | 20 kWh/100km | 4,480 | ¥1,524 | ¥0.076 | ¥0.550 saving |
| Porsche Taycan 4S | 22 kWh/100km | 4,928 | ¥1,676 | ¥0.084 | ¥0.542 saving |
The universal saving: Even the Porsche Taycan — the least efficient vehicle in this comparison at 22 kWh/100km — costs ¥0.084/km to charge at home TOU rates in Shanghai. The petrol equivalent (¥0.626/km) is 7.5× more expensive per kilometre. Every vehicle in this table provides dramatic fuel cost savings through home EV charging.
Understanding the Effective Rate — Your True Average Electricity Price
The calculator’s “effective rate” output — the blended average across all charging periods — is the single number that enables accurate financial planning.
Why the Effective Rate Matters
For ROI calculations:
Our EV home charger ROI calculator guide uses annual electricity costs. The effective rate is the input that makes those calculations accurate for your specific charging behaviour.
For cost-per-km comparisons:
¥/km = Effective rate × Efficiency (kWh/100km) × 1.12 ÷ 100
For comparing cities:
The effective rate accounts for both the TOU rate structure and your charging behaviour — giving a single comparable number across cities.
Effective Rate Reference — Shanghai Owner at Different Charging Mixes
| Scenario | Effective rate | Interpretation |
|---|---|---|
| 100% valley rate charging | ¥0.340/kWh | Perfect TOU optimisation |
| 90% valley, 10% flat | ¥0.373/kWh | Excellent TOU adherence |
| 85% valley, 10% flat, 5% peak | ¥0.390/kWh | Good TOU adherence (realistic target) |
| 70% valley, 20% flat, 10% peak | ¥0.447/kWh | Moderate TOU adherence |
| Standard socket, no TOU, immediate charging | ¥0.750/kWh | No TOU (blended non-TOU estimate) |
| 100% public DC fast charging | ¥1.80/kWh | No home charging |
The Beijing vs Shanghai Deep Comparison
These two cities are the most commonly compared in Chinese EV charging discussions — and the comparison is more nuanced than it initially appears.
The Rate Structure Difference
Beijing TOU structure:
- Valley (谷): ¥0.30/kWh — 23:00-07:00 (8 hours)
- Flat (平): ¥0.65/kWh
- Peak (峰): ¥0.85/kWh
Shanghai TOU structure:
- Valley (谷): ¥0.34/kWh — 23:00-08:00 (9 hours)
- Flat (平): ¥0.67/kWh
- Peak (峰): ¥0.87/kWh
The three key differences:
Difference 1: Beijing’s valley rate is ¥0.04/kWh lower than Shanghai’s
At 4,074 kWh annual consumption (85% at valley):
Beijing valley cost: 3,463 × ¥0.30 = ¥1,039
Shanghai valley cost: 3,463 × ¥0.34 = ¥1,177
Beijing saves ¥138/year on valley charging versus Shanghai.
Difference 2: Shanghai’s valley window is 1 hour longer (9 hours vs 8 hours)
For large-battery vehicles (NIO ET5 100 kWh, Zeekr 001 Privilege) needing long charge windows, Shanghai’s extra hour provides meaningful operational flexibility.
Difference 3: Similar peak and flat rate levels
Both cities have similar peak rates (¥0.87 Shanghai vs ¥0.85 Beijing) and similar flat rates (¥0.67 vs ¥0.65). The material difference is the valley rate.
The 5-Year Accumulated Cost Difference: Beijing vs Shanghai
BYD Han EV Long Range, 20,000 km/year, 85% valley charging:
| Year | Beijing annual | Shanghai annual | Beijing saving |
|---|---|---|---|
| Year 1 | ¥1,278 | ¥1,437 | ¥159 |
| Year 2 | ¥1,278 | ¥1,437 | ¥159 |
| Year 3 | ¥1,278 | ¥1,437 | ¥159 |
| Year 4 | ¥1,278 | ¥1,437 | ¥159 |
| Year 5 | ¥1,278 | ¥1,437 | ¥159 |
| 5-year total | ¥6,390 | ¥7,185 | ¥795 |
Beijing residents save ¥795 over 5 years purely from their lower valley electricity rate — a real but modest advantage that does not meaningfully affect the home charger investment case in either city.
The Petrol Comparison — What EV Home Charging Actually Replaces
For Chinese EV owners evaluating the running cost advantage of their vehicle over a petrol alternative, the home EV charging cost calculator produces the comparison number directly.
The Reference Petrol Cost Assumption
Petrol price used in calculator: ¥7.80/litre (2026 approximate premium unleaded in Chinese cities)
Reference petrol vehicle efficiency: 7.5 litres/100km (typical Chinese family saloon equivalent)
Petrol cost per 100km: 7.5 × ¥7.80 = ¥58.50/100km = ¥0.585/km
The Complete EV vs Petrol Running Cost Comparison
| Vehicle | EV home TOU cost/km | Petrol equivalent cost/km | Annual saving (20,000 km) |
|---|---|---|---|
| Wuling Mini EV (Shanghai) | ¥0.046 | ¥0.585 | ¥10,780 |
| BYD Dolphin (Shanghai) | ¥0.053 | ¥0.585 | ¥10,640 |
| BYD Han EV LR (Shanghai) | ¥0.069 | ¥0.585 | ¥10,320 |
| BYD Han EV LR (Beijing) | ¥0.064 | ¥0.585 | ¥10,420 |
| NIO ET5 75 kWh (Shanghai) | ¥0.076 | ¥0.585 | ¥10,180 |
| Porsche Taycan 4S (Shanghai) | ¥0.084 | ¥0.585 | ¥10,020 |
The striking finding: Even the Porsche Taycan — the least efficient EV in this comparison — saves ¥10,020/year in fuel costs versus a comparable petrol vehicle at home TOU rates. The fuel saving dwarfs the home charger installation cost (¥2,699-¥6,500) within the first year.
The annual fuel saving from home EV charging is the dominant financial advantage of EV ownership — larger than depreciation differences, insurance differences, or maintenance differences — and it is available only through home TOU charging.
The Tiered Volume Pricing Detail — When It Applies
Does Tiered Pricing Affect EV Charging Costs?
As explained at the opening of this guide, the dedicated EV charging meter has its own separate tier calculation. For most Chinese EV owners, this means:
EV meter annual consumption: 3,000-5,500 kWh (depending on vehicle and mileage)
Tier 1 limit: 2,760 kWh/year
Tier 2 range: 2,761-4,800 kWh/year (+¥0.05/kWh premium)
Tier 3 above: 4,800 kWh/year (+¥0.30/kWh premium)
When Does Tier 2 Apply to EV Owners?
For a BYD Han EV owner driving 15,000 km/year:
Annual kWh from charger: 15,000 × 18 × 1.12 ÷ 100 = 3,024 kWh
This falls within Tier 2 (2,761-4,800 kWh) — adding ¥0.05/kWh to all consumption above 2,760 kWh.
Tier 2 surcharge calculation:
Surcharge applies to: 3,024 – 2,760 = 264 kWh
Additional cost: 264 × ¥0.05 = ¥13.20/year
For higher mileage owners (25,000 km/year):
Annual kWh: 25,000 × 18 × 1.12 ÷ 100 = 5,040 kWh
Tier 2 portion (2,761-4,800): 2,040 kWh × ¥0.05 = ¥102
Tier 3 portion (above 4,800): 240 kWh × ¥0.30 = ¥72
Total tier surcharge: ¥174/year
The tier surcharge in perspective:
Even at 25,000 km/year with a ¥174 tier surcharge, the effective rate increase is approximately ¥0.03/kWh — adding less than 5% to the annual TOU electricity cost. The tier surcharge is real but modest compared to the ¥1,670+ TOU saving.
Common Calculation Mistakes — What Gets the Numbers Wrong
Mistake 1: Using Gross Battery Capacity Instead of Energy Consumed
Calculating annual charging cost as “battery capacity × number of full charges per year” overstates cost. Vehicles rarely charge from 0% to 100%. The correct input is annual kWh consumed from the charger — which the calculator derives from mileage and efficiency.
Mistake 2: Ignoring the 12% Charging Efficiency Loss
Every kWh delivered to the vehicle battery requires approximately 1.12 kWh from the charger. Calculating cost from battery energy rather than charger input understates electricity cost by approximately 12%.
Mistake 3: Assuming 100% Valley Rate Charging
Some online guides present TOU savings as if all home charging occurs at valley rate. In practice, most owners charge at 80-95% valley rate — with some sessions at flat rate when they arrive home early or charge at non-scheduled times. The calculator’s charging mix sliders reflect this reality.
Mistake 4: Using Public DC Rate for Home Charging Cost Calculation
Public DC fast charging rates (¥1.20-¥2.50/kWh) are sometimes used as the baseline for “electricity cost of EV ownership” — massively overstating the true home charging cost. Home TOU charging at ¥0.30-¥0.34/kWh is 4-8× cheaper than public DC. Any cost comparison that uses public DC rates for home EV running cost is not comparable to an owner who primarily home charges.
Internal Links — Further Reading on Clean Energy Bazaar
The home EV charging cost calculator factor in tiered electricity rates Beijing vs Shanghai guide is the electricity cost analysis companion to every financial planning guide in the Chinese market content cluster.
For the TOU savings guide that establishes the valley rate windows and annual saving calculations used throughout, our time-of-use EV charging savings smart chargers that exploit cheaper night rates in China guide covers every tariff. For the ROI calculator that converts annual electricity costs into payback periods and 5-year returns, our EV home charger ROI calculator 2026 when it pays off with local rebates included guide covers the complete financial picture. For the local rebates guide covering installation subsidies that reduce the upfront investment being evaluated against the running cost savings calculated here, our local utility rebates for EV charging 2026 Shenzhen Shanghai Beijing guide covers every available programme. For the charge time calculator that determines whether your vehicle’s charge time fits within the valley rate window assumed in the cost calculations, our EV charge time calculator 2026 how long to full for your Chinese EV BYD to NIO guide covers every scenario. For the tier 1 vs tier 2 city guide that contextualises why Beijing and Chengdu electricity rates differ from Shanghai and coastal cities, our tier 1 vs tier 2 city charging solutions for Beijing high-rises vs Chengdu villas vs rural villages guide covers every location. And for the professional installation costs guide covering the upfront investment that these annual savings are being evaluated against, our professional EV charger installation costs 2026 what State Grid chargers vs private companies charge guide covers every cost component.
Final Thoughts
The home EV charging cost calculator factor in tiered electricity rates Beijing vs Shanghai produces numbers that anchor every other financial decision in Chinese home EV ownership.
The headline numbers for the most common Chinese EV owner scenario (BYD Han EV Long Range, 20,000 km/year, 85% valley charging):
Beijing: ¥1,278/year — ¥0.064/km
Shanghai: ¥1,437/year — ¥0.072/km
Chengdu: ¥1,062/year — ¥0.053/km
Against petrol at ¥0.585/km: home EV charging in every Chinese city is 7-11× cheaper per kilometre than petrol.
Against public DC at ¥1.80/kWh: home TOU charging is 4-6× cheaper per year.
The three numbers every Chinese EV owner should know for their specific situation:
- Annual electricity cost — from the calculator with your actual city, vehicle, mileage, and charging mix
- Cost per kilometre — the electricity cost number that makes every fuel cost comparison accurate
- Annual saving versus petrol — the headline economic case for EV ownership that is available only through home TOU charging
Use the calculator. Enter your real charging mix — not the optimistic 100% valley scenario, but the realistic 80-90% valley that most diligent TOU schedulers actually achieve. The result is still dramatically cheaper than petrol and vastly cheaper than public DC charging.
That is the electricity cost reality of Chinese home EV ownership in 2026.