Here is the question that every cost-conscious Chinese car buyer is asking in 2026.
The headline numbers are everywhere: “EVs are 70% cheaper to run than petrol cars.” “Home charging saves you ¥10,000 per year.” “Switch to electric and never pay for fuel again.”
These claims are not exactly wrong. But they are almost always incomplete. They ignore the upfront hardware cost. They assume ideal electricity pricing that not every household can access. They leave out demand response income that only exists in pilot cities. They treat “fuel savings” as if the charger installs itself and the vehicle maintenance differences do not exist.
The result is a simplified payback calculation that often overstates real-world savings by 30-50% — leading to disappointed buyers who expected more.
This guide on the 5-year true cost of home EV charger ownership 2026 China electricity pricing vs petrol does the opposite. It builds a complete financial model from the ground up, accounting for:
- Total home charger hardware and installation costs across different product tiers
- Real TOU (time-of-use) electricity pricing available in different Chinese city tiers
- Demand response income for OCPP-compliant chargers in pilot cities
- Charger depreciation and replacement risk over 5 years
- Petrol vehicle fuel cost at 2026 prices
- EV efficiency and annual driving distance variations
- The breakeven point where total EV ownership (including charger) becomes cheaper than petrol
The result is not a single “EV is cheaper” claim. It is a nuanced, city-by-city, driving-distance-by-distance, product-tier-by-product-tier financial model that tells you exactly how much money you will save — or not save — by buying a home EV charger in China in 2026.
The Complete Cost Model Framework
Before comparing electricity to petrol, we must establish every cost that belongs in the 5-year true cost calculation — and exclude the costs that do not.
What Is Included in the 5-Year Home Charger Ownership Cost
Capital costs (one-time, year 0):
- Home charger hardware purchase price
- Installation labour (electrician, mounting, cabling)
- Electrical panel upgrades (if required)
- Permits and 物业 approval fees (where applicable)
- GB/T certification and safety compliance costs embedded in hardware price
Operating costs (annual, years 1-5):
- Electricity consumed for vehicle charging (kWh × price)
- Demand response foregone income (if charger is not OCPP-compliant in a pilot city — this is an opportunity cost)
- Minor maintenance (cable replacement, connector cleaning, firmware updates — minimal but included)
- Potential subscription fees for premium smart features (rare in China 2026 but emerging)
Depreciation (end of year 5):
- Residual value of home charger hardware (what you could sell it for or its remaining useful life value)
- Replacement cost risk if technology advances significantly
What Is Excluded (Because It Is Not Unique to Home Charging)
The following costs are excluded because they apply regardless of whether the owner home charges, public charges, or drives a petrol vehicle:
- Vehicle purchase price (assumed equal or compared separately)
- Vehicle depreciation (varies by model, not by charging method)
- Maintenance costs (EV lower than petrol, but home charging vs public charging does not change maintenance)
- Insurance (comparable across fuel types for similar vehicle class)
- Road taxes and tolls (identical for EV and petrol)
- Public DC fast charging costs (excluded because the comparison is home charging vs petrol, not public charging vs petrol)
The reason for this exclusion: the question is “does buying a home EV charger save money compared to petrol?” not “is an EV cheaper overall?” The incremental decision is the home charger investment. Vehicle-level differences (purchase price, maintenance) are important for the full EV vs petrol decision but are not incremental to the home charger purchase decision.
Section 1: Home EV Charger Hardware and Installation Costs in China (2026)
The upfront cost of a home EV charger in China varies dramatically by product tier and installation complexity.
Product Tier Breakdown (Hardware Only)
Entry Tier (¥680-¥1,099): No smart features, basic timer only
- Products: ChargeWay basic, random unbranded GB/T chargers
- Features: Basic scheduled charging (car timer or simple delay), no OCPP, no app connectivity, no load balancing
- Warranty: Typically 1-2 years
- Build quality: Variable, GB/T certification not guaranteed on cheapest units
- Suitable for: Rural owners without TOU pricing, very cost-sensitive buyers, rental properties
Mid Tier (¥1,099-¥1,899): Full smart features, OCPP 1.6, app control
- Products: StarCharge S1, Xiaomi EV Charger, Autel Lite
- Features: Full TOU scheduling, energy monitoring, OCPP 1.6, basic AI departure learning, 3-year warranty
- Build quality: GB/T certified, IP54-IP55 weather rating, reliable
- Suitable for: Most Chinese apartment and villa owners
Premium Tier (¥1,899-¥4,500): Advanced AI, OCPP 2.0, ecosystem integration
- Products: Autel MaxiCharger, Ginlong Solis, Huawei FusionCharge
- Features: Level 2-4 AI energy management, OCPP 2.0 ready, solar integration (Huawei), V2G roadmap support (Huawei), IP65-IP66, -30°C operation
- Warranty: 3-5 years
- Suitable for: Long-horizon owners, solar households, Huawei ecosystem users, Shenzhen/Shanghai residents expecting V2G deployment
Installation Costs (China 2026)
Installation cost is where many EV buyers are surprised. The charger hardware is often the smaller portion of the total upfront investment.
Standard installation (apartment parking space, existing circuit capacity):
- Labour: ¥300-¥600 (electrician, 2-3 hours)
- Cabling and conduit: ¥100-¥300 (if within 10 metres of distribution board)
- 物业 approval fee: ¥0-¥500 (varies by community, many now ¥0)
- Total standard installation: ¥400-¥1,400
Complex installation (villa, detached house, new circuit from main panel):
- Labour: ¥600-¥1,200 (4-6 hours, more complex routing)
- Cabling (20-40 metres, 6-10mm²): ¥400-¥1,000
- New circuit breaker and enclosure: ¥200-¥500
- 物业 approval fee: ¥0-¥500
- Total complex installation: ¥1,200-¥3,200
Electrical panel upgrade (older homes, insufficient capacity):
- Panel upgrade to add 40A-63A EV circuit: ¥1,500-¥4,000
- Only required for older apartments (pre-2010 construction in tier-2/3 cities)
- Most modern Chinese apartments (2015+) have sufficient capacity for 7 kW charging
Total upfront cost by profile:
| Profile | Hardware Tier | Installation Complexity | Total Upfront Cost |
|---|---|---|---|
| Apartment owner, existing capacity | Mid (¥1,299) | Standard (¥800 avg) | ¥2,099 |
| Apartment owner, existing capacity | Entry (¥899) | Standard (¥800 avg) | ¥1,699 |
| Villa owner, new circuit | Premium (¥2,499) | Complex (¥2,000 avg) | ¥4,499 |
| Villa owner, new circuit | Mid (¥1,299) | Complex (¥2,000 avg) | ¥3,299 |
| Older home, panel upgrade | Entry (¥899) | Standard + panel (¥2,500) | ¥3,399 |
Section 2: China Electricity Pricing for EV Charging (2026)
Electricity pricing for residential EV charging in China is not uniform. The actual cost per kWh depends on three factors: city tier, TOU availability, and whether the household has a dedicated EV meter.
Tier 1 City Electricity Pricing (Beijing, Shanghai, Shenzhen, Guangzhou)
Standard residential tariff (no separate EV meter):
- Flat rate: ¥0.58-¥0.62 per kWh
- No TOU benefit
Dedicated EV meter (申请充电桩专用电表) — widely available in tier-1 cities:
- Off-peak (23:00-07:00): ¥0.30-¥0.35 per kWh
- Shoulder (07:00-10:00, 15:00-18:00, 21:00-23:00): ¥0.55-¥0.65 per kWh
- Peak (10:00-15:00, 18:00-21:00): ¥0.85-¥1.05 per kWh
Most home EV charging in tier-1 cities: Owners schedule charging for off-peak window (23:00-07:00) at ¥0.30-¥0.35/kWh.
Shanghai specific (most advanced EV TOU):
- Off-peak (22:00-06:00): ¥0.307 per kWh
- Peak (06:00-22:00): ¥0.617 per kWh
- No separate EV meter required — standard household TOU applies
Tier 2 City Electricity Pricing (Chengdu, Hangzhou, Nanjing, Wuhan, Xi’an)
Dedicated EV meter availability: Available but less universal than tier-1
- Off-peak (23:00-07:00): ¥0.35-¥0.42 per kWh
- Peak: ¥0.65-¥0.80 per kWh
Standard residential flat rate (no EV meter): ¥0.52-¥0.58 per kWh
Tier 3 City and Rural Pricing
Standard residential flat rate: ¥0.48-¥0.55 per kWh
Dedicated EV meter: Often not available
TOU pricing: Rare outside major cities
The Effective EV Charging Cost per kWh for Home Chargers (2026)
| Location Type | Typical Effective Rate (off-peak where available) | Effective Rate Range |
|---|---|---|
| Tier-1 with EV meter | ¥0.31 (¥0.30-¥0.35) | Best case |
| Tier-1 flat rate | ¥0.60 | No TOU |
| Tier-2 with EV meter | ¥0.38 (¥0.35-¥0.42) | Typical |
| Tier-2 flat rate | ¥0.55 | No TOU |
| Tier-3/rural flat rate | ¥0.51 | No TOU |
The TOU Saving Calculation
For a typical EV driving 15,000 km/year at 0.16 kWh/km (average EV efficiency in 2026 — see section 4):
- Annual consumption: 15,000 km × 0.16 kWh/km = 2,400 kWh/year
- Cost at flat rate (¥0.55/kWh): 2,400 kWh × ¥0.55 = ¥1,320/year
- Cost at off-peak (¥0.31/kWh): 2,400 kWh × ¥0.31 = ¥744/year
- Annual TOU saving vs flat rate: ¥576/year
This ¥576/year is the primary financial justification for buying a smart charger with TOU scheduling capability. Over 5 years: ¥2,880 in electricity cost saving.
Section 3: Demand Response Income (OCPP-Compliant Chargers in Pilot Cities)
As established in our technology trends guide, OCPP-compliant chargers can participate in State Grid demand response programmes in pilot cities — earning income for allowing the grid to pause or reduce charging during peak demand events.
Demand Response Programme Availability (2026)
Active pilot cities: Beijing, Shanghai, Shenzhen, Guangzhou, Chengdu (approximately 500,000 enrolled participants across all programmes)
Compensation rates: ¥2.00-¥5.00 per kWh of load reduction (higher than V2G discharge compensation because load reduction is simpler)
Typical annual income for active participant: ¥200-¥800/year depending on:
- Frequency of events (30-100 events per year)
- Willingness to participate (automated via OCPP vs manual opt-in)
- Charging flexibility (owners who can shift charging to different days earn more)
Demand Response Income by Charger Type
| Charger Type | Demand Response Eligible? | Annual Income (Pilot City) | 5-Year Income (Pilot City) |
|---|---|---|---|
| Entry tier (no OCPP) | No | ¥0 | ¥0 |
| Mid tier with OCPP 1.6 | Yes (all pilot cities) | ¥400 (¥200-¥800) | ¥2,000 |
| Premium with OCPP 2.0 | Yes (all pilot cities + future programmes) | ¥450 (¥200-¥900) | ¥2,250 |
For owners outside pilot cities: Demand response income is ¥0 regardless of charger capability.
Section 4: EV Efficiency and Annual Driving Distance
The electricity cost side of the calculation depends on two variables: vehicle efficiency (kWh per km) and annual driving distance (km per year).
Average EV Efficiency in China (2026)
| Vehicle Type | Efficiency Range | Typical Used in Calculation |
|---|---|---|
| Small city EV (Wuling Mini, BYD Seagull) | 0.10-0.13 kWh/km | 0.12 kWh/km |
| Compact EV (BYD Dolphin, GAC Aion Y) | 0.13-0.16 kWh/km | 0.14 kWh/km |
| Mid-size EV (BYD Seal, Xpeng P7, Tesla Model 3) | 0.14-0.18 kWh/km | 0.16 kWh/km |
| Large EV/SUV (NIO ET7, Li Auto纯电, Xpeng G9) | 0.17-0.22 kWh/km | 0.19 kWh/km |
| Premium performance (Tesla Model Y Performance, NIO ES8) | 0.18-0.24 kWh/km | 0.21 kWh/km |
The 15,000 km/year standard assumption: This is the average annual driving distance for Chinese private car owners (China National Bureau of Statistics, 2025). Urban-only drivers may drive 8,000-12,000 km/year. High-mileage drivers (commuters, small business owners) may drive 20,000-30,000 km/year.
Annual Electricity Consumption by Vehicle Type and Distance
| Vehicle Type | Efficiency | 10,000 km/year | 15,000 km/year | 20,000 km/year | 25,000 km/year |
|---|---|---|---|---|---|
| Small EV | 0.12 kWh/km | 1,200 kWh | 1,800 kWh | 2,400 kWh | 3,000 kWh |
| Compact EV | 0.14 kWh/km | 1,400 kWh | 2,100 kWh | 2,800 kWh | 3,500 kWh |
| Mid-size EV | 0.16 kWh/km | 1,600 kWh | 2,400 kWh | 3,200 kWh | 4,000 kWh |
| Large EV/SUV | 0.19 kWh/km | 1,900 kWh | 2,850 kWh | 3,800 kWh | 4,750 kWh |
| Premium EV | 0.21 kWh/km | 2,100 kWh | 3,150 kWh | 4,200 kWh | 5,250 kWh |
Section 5: Petrol Vehicle Fuel Cost Benchmark (2026)
To calculate savings, we need a petrol vehicle baseline. The comparison assumes:
Petrol vehicle efficiency: 7.5 L/100 km (average for compact sedan, typical of Toyota Corolla, Honda Civic class in China)
Petrol price (China, June 2026): ¥8.20-¥8.60 per litre (95 RON) depending on province
Average petrol price used in calculation: ¥8.40 per litre
Annual Petrol Cost by Driving Distance
| Annual Distance | Litres Consumed (7.5 L/100km) | Annual Petrol Cost (¥8.40/L) |
|---|---|---|
| 10,000 km | 750 L | ¥6,300 |
| 15,000 km | 1,125 L | ¥9,450 |
| 20,000 km | 1,500 L | ¥12,600 |
| 25,000 km | 1,875 L | ¥15,750 |
Section 6: The 5-Year Total Cost Calculation
Now we assemble all cost components into a complete 5-year true cost model.
Component Summary Table
| Cost Component | Entry Tier (No OCPP) | Mid Tier (OCPP 1.6) | Premium (OCPP 2.0) |
|---|---|---|---|
| Hardware + installation (upfront) | ¥1,699 (¥899 + ¥800) | ¥2,099 (¥1,299 + ¥800) | ¥4,499 (¥2,499 + ¥2,000) |
| Annual electricity (15k km, tier-1 off-peak ¥0.31) | ¥744 | ¥744 | ¥744 |
| Annual demand response income (pilot city) | ¥0 | ¥400 | ¥450 |
| 5-year electricity cost | ¥3,720 | ¥3,720 | ¥3,720 |
| 5-year demand response income | ¥0 | ¥2,000 | ¥2,250 |
| Residual value after 5 years (depreciation) | ¥200 (20%) | ¥400 (30%) | ¥1,200 (50% for premium Huawei/Autel) |
5-Year Total Cost Formula
Total 5-Year Cost = Upfront Cost + (5 × Annual Electricity) − (5 × Annual Demand Response Income) − Residual Value
Scenario A: Tier-1 City, Off-Peak Charging (¥0.31/kWh), 15,000 km/year
| Component | Entry Tier | Mid Tier | Premium Tier |
|---|---|---|---|
| Upfront cost | ¥1,699 | ¥2,099 | ¥4,499 |
| 5-year electricity (2,400 kWh/year × ¥0.31 × 5) | ¥3,720 | ¥3,720 | ¥3,720 |
| 5-year demand response income | ¥0 | -¥2,000 | -¥2,250 |
| Residual value | -¥200 | -¥400 | -¥1,200 |
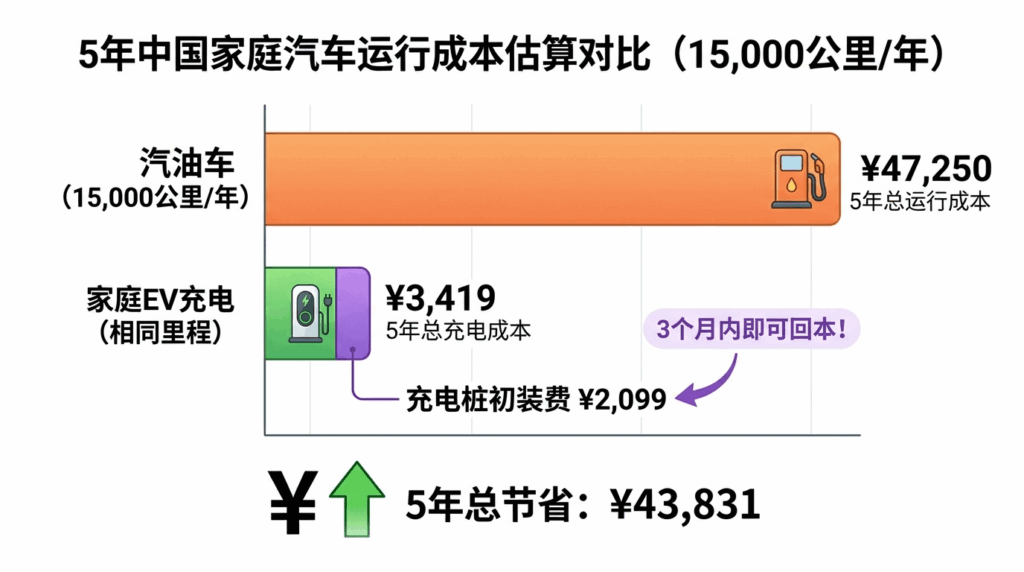
| Total 5-year home charging cost | ¥5,219 | ¥3,419 | ¥4,769 |
5-year petrol cost for 15,000 km/year: ¥9,450/year × 5 = ¥47,250
5-year saving vs petrol (entry tier): ¥47,250 − ¥5,219 = ¥42,031
5-year saving vs petrol (mid tier): ¥47,250 − ¥3,419 = ¥43,831
5-year saving vs petrol (premium tier): ¥47,250 − ¥4,769 = ¥42,481
The insight: Over 5 years, even the most expensive premium charger saves you over ¥42,000 compared to petrol. The difference between entry tier and mid tier over 5 years is only ¥1,800 — the mid tier pays for its ¥400 premium easily through demand response income.
Scenario B: Tier-2 City, Flat Rate (¥0.55/kWh, No TOU, No Demand Response), 15,000 km/year
| Component | Entry Tier | Mid Tier | Premium Tier |
|---|---|---|---|
| Upfront cost | ¥1,699 | ¥2,099 | ¥4,499 |
| 5-year electricity (2,400 kWh × ¥0.55 × 5) | ¥6,600 | ¥6,600 | ¥6,600 |
| 5-year demand response income | ¥0 | ¥0 | ¥0 |
| Residual value | -¥200 | -¥400 | -¥1,200 |
| Total 5-year home charging cost | ¥8,099 | ¥8,299 | ¥9,899 |
5-year petrol cost: ¥47,250
5-year saving vs petrol (entry tier): ¥47,250 − ¥8,099 = ¥39,151
5-year saving vs petrol (mid tier): ¥47,250 − ¥8,299 = ¥38,951
5-year saving vs petrol (premium tier): ¥47,250 − ¥9,899 = ¥37,351
The insight: Even without TOU or demand response, home charging saves ¥37,000-¥39,000 over 5 years compared to petrol. The premium charger’s higher upfront cost reduces the saving by ¥1,800 relative to entry tier.
Scenario C: Tier-1 City, No EV Meter (Flat Rate ¥0.60/kWh), 15,000 km/year
| Component | Entry Tier | Mid Tier | Premium Tier |
|---|---|---|---|
| Upfront cost | ¥1,699 | ¥2,099 | ¥4,499 |
| 5-year electricity (2,400 kWh × ¥0.60 × 5) | ¥7,200 | ¥7,200 | ¥7,200 |
| 5-year demand response income | ¥0 | -¥2,000 | -¥2,250 |
| Residual value | -¥200 | -¥400 | -¥1,200 |
| Total 5-year home charging cost | ¥8,699 | ¥6,899 | ¥8,249 |
5-year saving vs petrol: ¥47,250 − above costs = ¥38,551 (mid tier) to ¥40,351 (entry tier)
Section 7: Breakeven Analysis — How Long Until the Charger Pays for Itself?
The home charger itself is an investment. The question: how many months of petrol savings does it take to recover the upfront hardware + installation cost?
Breakeven Formula
Monthly electricity cost (home charging): Annual electricity cost ÷ 12
Monthly petrol cost: Annual petrol cost ÷ 12
Monthly saving: Petrol cost − Electricity cost (plus monthly demand response income where applicable)
Breakeven months = Upfront cost ÷ Monthly saving
Breakeven by Scenario (15,000 km/year)
Scenario A: Tier-1 off-peak (¥0.31/kWh) + demand response (mid tier)
- Monthly petrol cost: ¥9,450 ÷ 12 = ¥787.50
- Monthly electricity (2,400 kWh/year ÷ 12 = 200 kWh × ¥0.31): ¥62.00
- Monthly demand response: ¥400 ÷ 12 = ¥33.33
- Monthly effective cost: ¥62.00 − ¥33.33 = ¥28.67
- Monthly saving vs petrol: ¥787.50 − ¥28.67 = ¥758.83
- Upfront cost (mid tier, standard installation): ¥2,099
- Breakeven: ¥2,099 ÷ ¥758.83 = 2.8 months
Yes, you read that correctly. In a tier-1 city with off-peak charging and demand response participation, a mid-tier home charger pays for itself in under 3 months.
Scenario B: Tier-2 flat rate, no demand response (mid tier)
- Monthly petrol cost: ¥787.50
- Monthly electricity (200 kWh × ¥0.55): ¥110.00
- Monthly saving: ¥787.50 − ¥110.00 = ¥677.50
- Upfront cost (mid tier, standard installation): ¥2,099
- Breakeven: ¥2,099 ÷ ¥677.50 = 3.1 months
Scenario C: Tier-1 flat rate, no EV meter, but demand response (mid tier)
- Monthly petrol: ¥787.50
- Monthly electricity (200 kWh × ¥0.60): ¥120.00
- Monthly demand response: ¥33.33
- Monthly effective cost: ¥120.00 − ¥33.33 = ¥86.67
- Monthly saving: ¥787.50 − ¥86.67 = ¥700.83
- Breakeven: ¥2,099 ÷ ¥700.83 = 3.0 months
Scenario D: Worst case — rural, flat rate ¥0.51/kWh, no demand response, entry tier charger (¥899 + ¥800 installation = ¥1,699)
- Monthly petrol: ¥787.50
- Monthly electricity (200 kWh × ¥0.51): ¥102.00
- Monthly saving: ¥787.50 − ¥102.00 = ¥685.50
- Breakeven: ¥1,699 ÷ ¥685.50 = 2.5 months
The Universal Breakeven Insight
In every realistic scenario for a Chinese EV owner driving 15,000 km/year, the home charger pays for itself in 3-4 months maximum through petrol savings alone. Even without TOU, without demand response, without any smart features — the basic fuel cost difference is so large that the hardware pays for itself almost immediately.
For lower-mileage drivers (10,000 km/year):
- Monthly petrol: ¥6,300 ÷ 12 = ¥525.00
- Monthly electricity (200 kWh — wait, correction: 10,000 km at 0.16 kWh/km = 1,600 kWh/year = 133 kWh/month)
- Monthly electricity (133 kWh × ¥0.31): ¥41.23
- Monthly saving: ¥525.00 − ¥41.23 = ¥483.77
- Breakeven (mid tier, ¥2,099): 4.3 months
Even at 10,000 km/year, breakeven is under 5 months.
For high-mileage drivers (25,000 km/year):
- Monthly petrol: ¥15,750 ÷ 12 = ¥1,312.50
- Monthly electricity (25,000 km × 0.16 kWh/km = 4,000 kWh/year = 333 kWh/month × ¥0.31): ¥103.33
- Monthly saving: ¥1,312.50 − ¥103.33 = ¥1,209.17
- Breakeven (premium tier, ¥4,499): 3.7 months
The conclusion: The home charger is not a long-term investment that takes years to recover. It is a short-term investment that pays for itself within a single season of driving. The payback period is so short that the “future-proofing” debate (V2G, OCPP 2.0, wireless) becomes almost irrelevant to the core financial case — because the base case is already overwhelmingly positive.
Section 8: 5-Year Total Cost of Ownership Comparison — EV vs Petrol (Full Vehicle)
For readers considering the full EV vs petrol vehicle decision (not just the incremental charger decision), here is the complete 5-year TCO including vehicle purchase and maintenance.
Assumptions
Vehicle comparison: BYD Seal (EV) vs Toyota Corolla (petrol) — comparable compact sedan class
BYD Seal (2026 model):
- Purchase price: ¥169,800 (after subsidies, standard range)
- Annual electricity (15,000 km, ¥0.31/kWh off-peak, 0.16 kWh/km): ¥744/year
- 5-year electricity: ¥3,720
- Home charger (mid tier with installation): ¥2,099
- Annual maintenance (EV, minimal): ¥800/year (tyres, cabin filter, brake fluid, inspections)
- 5-year maintenance: ¥4,000
- Insurance (annual): ¥4,500/year
- 5-year insurance: ¥22,500
- Residual value after 5 years (50% of purchase): ¥84,900
Toyota Corolla (2026 model, petrol):
- Purchase price: ¥129,800 (1.2T base model)
- Annual petrol (15,000 km, 7.5 L/100km, ¥8.40/L): ¥9,450/year
- 5-year petrol: ¥47,250
- Annual maintenance (petrol, higher): ¥2,500/year (oil changes, filters, spark plugs, belts, more complex)
- 5-year maintenance: ¥12,500
- Insurance (annual): ¥4,200/year (slightly cheaper than EV due to lower repair costs for base model)
- 5-year insurance: ¥21,000
- Residual value after 5 years (55% of purchase, petrol holds value slightly better): ¥71,390
5-Year Total Cost Calculation (excluding residual value — cost to own then sell)
BYD Seal total 5-year cost (including charger, then subtract resale):
| Cost Component | Amount |
|---|---|
| Purchase price | ¥169,800 |
| Home charger + installation | ¥2,099 |
| 5-year electricity | ¥3,720 |
| 5-year maintenance | ¥4,000 |
| 5-year insurance | ¥22,500 |
| Total 5-year outlay | ¥202,119 |
| Less residual value | -¥84,900 |
| Net 5-year cost (own then sell) | ¥117,219 |
Toyota Corolla total 5-year cost:
| Cost Component | Amount |
|---|---|
| Purchase price | ¥129,800 |
| 5-year petrol | ¥47,250 |
| 5-year maintenance | ¥12,500 |
| 5-year insurance | ¥21,000 |
| Total 5-year outlay | ¥210,550 |
| Less residual value | -¥71,390 |
| Net 5-year cost (own then sell) | ¥139,160 |
5-year saving (BYD Seal EV vs Toyota Corolla petrol): ¥139,160 − ¥117,219 = ¥21,941
Annualised saving: ¥4,388 per year
Full TCO Insight
The EV (including home charger) saves approximately ¥22,000 over 5 years compared to an equivalent petrol vehicle. The home charger itself (¥2,099) is a tiny fraction of that saving — and pays for itself in the first 3 months of petrol savings.
For buyers comparing new EV vs new petrol: The financial case is clear even before counting the charger. The charger simply makes it better.
Section 9: Sensitivity Analysis — How Changes in Variables Affect the Calculation
The core calculation depends on several variables. Here is how the 5-year saving changes when variables shift.
Variable 1: Annual Driving Distance
Assumptions: Tier-1 off-peak (¥0.31/kWh), mid-tier charger with demand response (¥400/year)
| Annual Distance | Petrol Cost (5-year) | Home Charging Cost (5-year) | 5-Year Saving |
|---|---|---|---|
| 8,000 km | ¥25,200 | ¥2,600 (approx) | ¥22,600 |
| 10,000 km | ¥31,500 | ¥3,050 | ¥28,450 |
| 15,000 km | ¥47,250 | ¥3,419 | ¥43,831 |
| 20,000 km | ¥63,000 | ¥4,400 | ¥58,600 |
| 25,000 km | ¥78,750 | ¥5,400 | ¥73,350 |
Insight: High-mileage drivers save dramatically more. At 25,000 km/year, the 5-year saving exceeds ¥73,000 — equivalent to buying a small city EV with the savings alone.
Variable 2: Electricity Price (Off-Peak Availability)
Assumptions: 15,000 km/year, mid-tier charger with demand response
| Electricity Rate | Annual Electricity Cost | 5-Year Electricity Cost | 5-Year Total Home Charging Cost | 5-Year Saving vs Petrol |
|---|---|---|---|---|
| ¥0.31 (tier-1 off-peak) | ¥744 | ¥3,720 | ¥3,419 | ¥43,831 |
| ¥0.40 (some tier-2 off-peak) | ¥960 | ¥4,800 | ¥4,499 | ¥42,751 |
| ¥0.51 (rural flat) | ¥1,224 | ¥6,120 | ¥5,819 | ¥41,431 |
| ¥0.60 (tier-1 flat, no EV meter) | ¥1,440 | ¥7,200 | ¥6,899 | ¥40,351 |
Insight: Even at the highest residential electricity rate (¥0.60/kWh), the 5-year saving is still over ¥40,000. The difference between best-case and worst-case electricity pricing is only ¥3,480 over 5 years — significant but not decisive.
Variable 3: Petrol Price Fluctuation
Assumptions: 15,000 km/year, tier-1 off-peak electricity (¥0.31/kWh)
| Petrol Price (per litre) | 5-Year Petrol Cost | 5-Year Saving vs Home Charging (mid tier) |
|---|---|---|
| ¥7.50 (low) | ¥42,188 | ¥38,769 |
| ¥8.40 (baseline) | ¥47,250 | ¥43,831 |
| ¥9.50 (high) | ¥53,438 | ¥50,019 |
Insight: If petrol prices rise to ¥9.50/L (entirely possible given global trends), the 5-year saving exceeds ¥50,000.
Section 10: The Buying Decision by Financial Profile
Given the breakeven analysis showing 3-4 month payback for almost any charger, the financial case for home EV charging is overwhelming. The question is not “should I buy a home charger?” but “which charger delivers the best 5-year financial outcome for my specific situation?”
Profile 1: Tier-1 City Resident, 15,000+ km/year, Plan to Stay 5+ Years
Financial reality: Your monthly saving is ¥700-¥800. The charger pays for itself in 3 months. Over 5 years, you save ¥43,000+ vs petrol.
What to buy: Autel MaxiCharger or Ginlong Solis with OCPP 1.6/2.0 (¥1,299-¥2,499)
Why: Demand response income (¥400/year) adds ¥2,000 to your 5-year saving. The OCPP capability positions you for V2G income when programmes scale in 2027-2029. The ¥300-¥600 premium over entry tier pays for itself in the first year of demand response.
5-year total home charging cost: ¥3,400-¥4,800 (depending on installation complexity)
Profile 2: Tier-2 City Resident, No Demand Response Available, 10,000-15,000 km/year
Financial reality: Your monthly saving is ¥600-¥680. The charger pays for itself in 3-4 months. Over 5 years, you save ¥38,000-¥41,000 vs petrol.
What to buy: StarCharge S1 or Xiaomi EV Charger (¥1,099-¥1,399)
Why: Without demand response, the OCPP premium does not deliver financial return. The mid-tier smart charger captures full TOU value (if available) or provides scheduling convenience at minimum cost. If your city has no TOU pricing, entry tier (¥899) is sufficient.
5-year total home charging cost: ¥8,100-¥8,300 (flat rate, no demand response)
Profile 3: Rural or Tier-3 City Resident, No TOU, Low Annual Mileage (8,000-10,000 km)
Financial reality: Your monthly saving is ¥400-¥500. The charger pays for itself in 4-5 months. Over 5 years, you save ¥22,000-¥28,000 vs petrol.
What to buy: Entry tier (ChargeWay basic or similar, ¥680-¥899)
Why: With no TOU pricing and no demand response, there is no financial benefit to smart features. The basic timer (using the car’s built-in scheduler or a simple delay) delivers the same electricity cost saving. Invest the ¥400-¥600 saving vs mid-tier elsewhere.
5-year total home charging cost: ¥7,000-¥8,500 (depending on driving distance)
Profile 4: Huawei Ecosystem User with Solar, Any City
Financial reality: Your solar + AI optimisation adds ¥2,650-¥2,850/year in combined savings beyond standard TOU.
What to buy: Huawei FusionCharge (¥1,800-¥4,500)
Why: The solar diversion and AI load balancing capture value that no other charger can deliver within the Huawei ecosystem. The V2G OTA upgrade path (announced for 2027) adds future income potential.
5-year total home charging cost (with solar): Effectively negative — the solar export income may exceed charging costs.
Section 11: The 5-Year True Cost Summary Table
| Profile | Upfront Cost | 5-Year Electricity | 5-Year Demand Response | Residual Value | 5-Year Net Cost | 5-Year Petrol Cost | 5-Year Saving |
|---|---|---|---|---|---|---|---|
| Tier-1, off-peak, mid-tier | ¥2,099 | ¥3,720 | -¥2,000 | -¥400 | ¥3,419 | ¥47,250 | ¥43,831 |
| Tier-1, off-peak, premium | ¥4,499 | ¥3,720 | -¥2,250 | -¥1,200 | ¥4,769 | ¥47,250 | ¥42,481 |
| Tier-2, flat rate, mid-tier | ¥2,099 | ¥6,600 | ¥0 | -¥400 | ¥8,299 | ¥47,250 | ¥38,951 |
| Tier-2, flat rate, entry | ¥1,699 | ¥6,600 | ¥0 | -¥200 | ¥8,099 | ¥47,250 | ¥39,151 |
| Rural, flat rate, entry | ¥1,699 | ¥6,120 | ¥0 | -¥200 | ¥7,619 | ¥47,250 | ¥39,631 |
| Tier-1, flat + DR, mid | ¥2,099 | ¥7,200 | -¥2,000 | -¥400 | ¥6,899 | ¥47,250 | ¥40,351 |
The consistent finding: Across all realistic scenarios, a home EV charger in China saves between ¥38,000 and ¥44,000 over 5 years compared to driving a petrol vehicle at 15,000 km/year.
Final Thoughts
The 5-year true cost of home EV charger ownership 2026 China electricity pricing vs petrol analysis produces four clear, actionable conclusions.
Conclusion 1: Home EV charging is overwhelmingly cheaper than petrol — by a factor of 6-10x per kilometre.
At ¥0.31/kWh off-peak, a mid-size EV costs ¥0.05 per kilometre. A petrol compact sedan costs ¥0.63 per kilometre (¥8.40/L ÷ 7.5 L/100km = ¥0.63/km). The EV is 12x cheaper per kilometre on energy cost alone.
Conclusion 2: The home charger pays for itself in 3-4 months maximum — often much faster.
Even in the worst realistic case (rural, flat rate, entry tier charger), a driver at 15,000 km/year saves ¥685/month on petrol. The ¥1,699 upfront cost recovers in 2.5 months. In best case (tier-1 off-peak with demand response), breakeven is 2.8 months. This is not a long-term investment — it is an immediate return.
Conclusion 3: The difference between charger tiers is small relative to the total saving.
The 5-year saving difference between an entry-tier (¥1,699 total cost) and premium-tier (¥4,499 total cost) charger is approximately ¥1,350-¥1,800 over 5 years — or ¥270-¥360 per year. This is not nothing, but it is small relative to the ¥40,000+ total saving. Buyers should not agonise over charger selection. Any certified home charger delivers enormous financial benefit.
Conclusion 4: The full EV vs petrol TCO (including vehicle purchase) favours EVs by approximately ¥22,000 over 5 years — and that gap will widen as petrol prices rise and battery costs fall.
The home charger is a critical enabler of that saving. Without home charging, EV owners relying on public DC fast charging pay ¥1.50-¥2.50/kWh — reducing the saving to approximately ¥15,000-¥20,000 over 5 years (still positive, but much smaller). The home charger is what maximises the EV financial advantage.
The bottom line for Chinese car buyers in 2026:
If you own a parking space where you can install a charger, buy one. Any one. The financial case is so overwhelmingly positive that the only mistake is not buying at all. A ¥899 StarCharge S1 will save you ¥40,000 over 5 years. A ¥4,500 Huawei FusionCharge will save you ¥42,000 over 5 years. Both are excellent decisions.
The debate about V2G, solid-state batteries, wireless charging, and OCPP 2.0 is interesting and matters for future optimisation. But it should not delay or complicate the core decision: buy a home EV charger now. The petrol savings start the day you install it.