Here’s what almost every home EV charger guide gets wrong.
They compare purchase prices. Sometimes they include installation costs. Very occasionally they mention electricity rates. And then they stop — as though the decision ends at the moment the charger is installed and the first charging session is complete.
It doesn’t. The home EV charger you install today will be in use for 7-10 years. The electricity it consumes will cost you money every single day. The maintenance it requires — or doesn’t — affects total cost of ownership in ways that aren’t obvious from the spec sheet. The incentives you claim, or miss, can change the net cost by thousands. And the smart features — or lack of them — determine whether your charger works with or against your electricity tariff over its entire lifespan.
The 5-year true cost of home EV charger ownership 2026 US vs Europe comparison is the analysis that helps you make a genuinely informed decision — not just about which charger costs less to buy, but about which one costs less to own, operate, and benefit from over the time period that actually matters.
This guide builds the complete 5-year cost picture for representative buyers in the US (California, Texas, Midwest), UK, and major European markets — covering every cost component honestly, including the components that most buyers discover only after purchase.
The True Cost Framework — What Goes Into the 5-Year Calculation
Before getting into specific numbers, establishing what “true cost of ownership” includes is essential — because the definition determines which costs are visible and which are hidden.
Cost Components That Go Into the 5-Year True Cost
Component 1: Hardware cost (net of incentives) The charger unit purchase price, minus any applicable grants, rebates, or tax credits. This is the component most guides cover. It’s typically the smallest component of true 5-year cost.
Component 2: Installation cost (net of incentives) Professional electrician installation, permit fees, materials (cable, conduit, circuit breaker), and any panel work required. Minus applicable grants and tax credits. Often equals or exceeds the hardware cost.
Component 3: Electricity cost over 5 years The ongoing cost of the electricity consumed for EV charging over 5 years. This is typically the largest single component of true 5-year cost — larger than hardware and installation combined for most owners. Yet most guides either ignore it or treat it as outside the “charger cost” calculation.
Component 4: Smart feature financial value (negative cost) The financial benefit of smart features that reduce electricity costs — TOU scheduling savings, solar divert savings, load management savings (avoided panel upgrade). These are negative costs — they reduce total cost of ownership.
Component 5: Maintenance and servicing cost The cost of maintaining the charger over 5 years. For most modern home EV chargers this is genuinely low — the hardware is reliable and maintenance is minimal. But it’s not zero.
Component 6: Opportunity cost of suboptimal charging setup The cost of NOT having the right charger — relying more heavily on public DC fast charging when home charging is inconvenient or absent, paying higher per-kWh rates at public stations. This is the most commonly ignored component and one of the most significant for buyers who underinvest in home charging.
What the Framework Reveals
When all six components are included, the total 5-year true cost picture often looks very different from the purchase price comparison most buyers make:
- A $229 dumb charger with no TOU scheduling can cost more over 5 years than a $599 smart charger on a TOU tariff — because the electricity savings from smart scheduling exceed the hardware price difference within 2-3 years.
- A charger bought without the OZEV grant in the UK costs £350 more than one bought with it — the most expensive mistake in the process that requires a single piece of prior knowledge.
- A buyer who installs a basic Level 1 charger to save $200 on a Level 2 setup and spends $500 more on public DC fast charging over 5 years has made the more expensive decision by a factor of 2.5x.
Electricity Cost — The Component That Dominates 5-Year True Cost
Most buyers focus on hardware and installation costs and treat electricity as a given. This gets the priorities wrong. Electricity is the dominant cost component in 5-year home EV charging economics.
US Electricity Cost Calculation
Typical US EV driving:
- Annual mileage: 15,000 miles (24,000 km)
- Average EV efficiency: 3.5 miles/kWh (typical for mainstream EVs)
- Annual kWh consumed for driving: 15,000 ÷ 3.5 = 4,286 kWh
- Charging efficiency (AC charging losses): approximately 15%
- kWh drawn from charger annually: 4,286 × 1.15 = 4,929 kWh
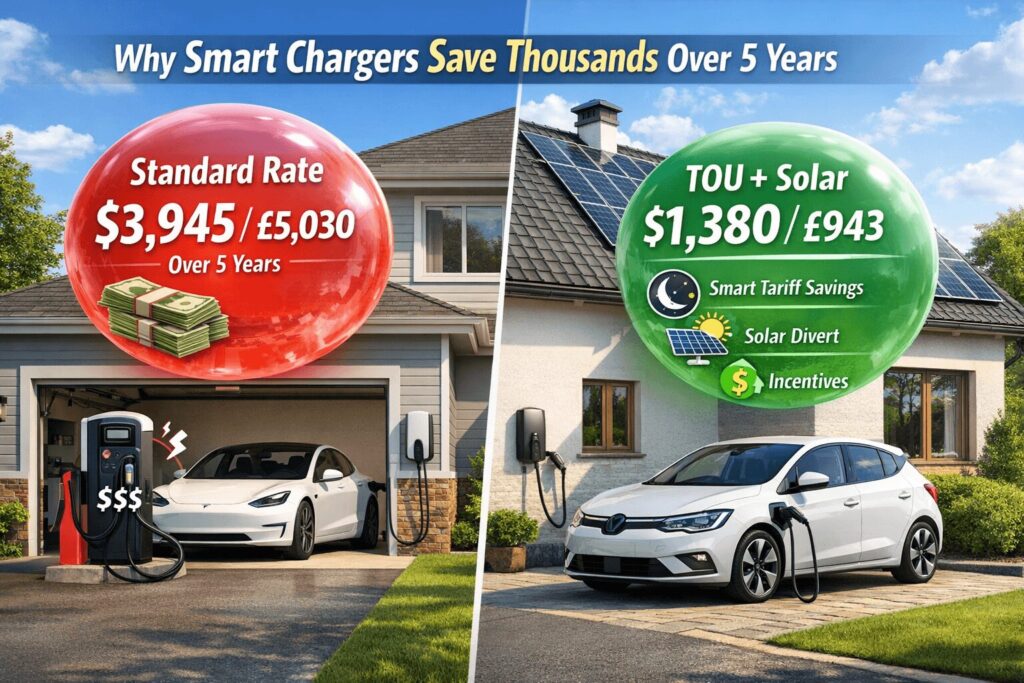
Without TOU scheduling (average US residential rate $0.16/kWh):
- Annual electricity cost: 4,929 × $0.16 = $789/year
- 5-year electricity cost: $3,945
With TOU scheduling (overnight rate $0.08/kWh — typical US TOU tariff off-peak):
- Annual electricity cost: 4,929 × $0.08 = $394/year
- 5-year electricity cost: $1,970
- 5-year TOU scheduling saving: $1,975
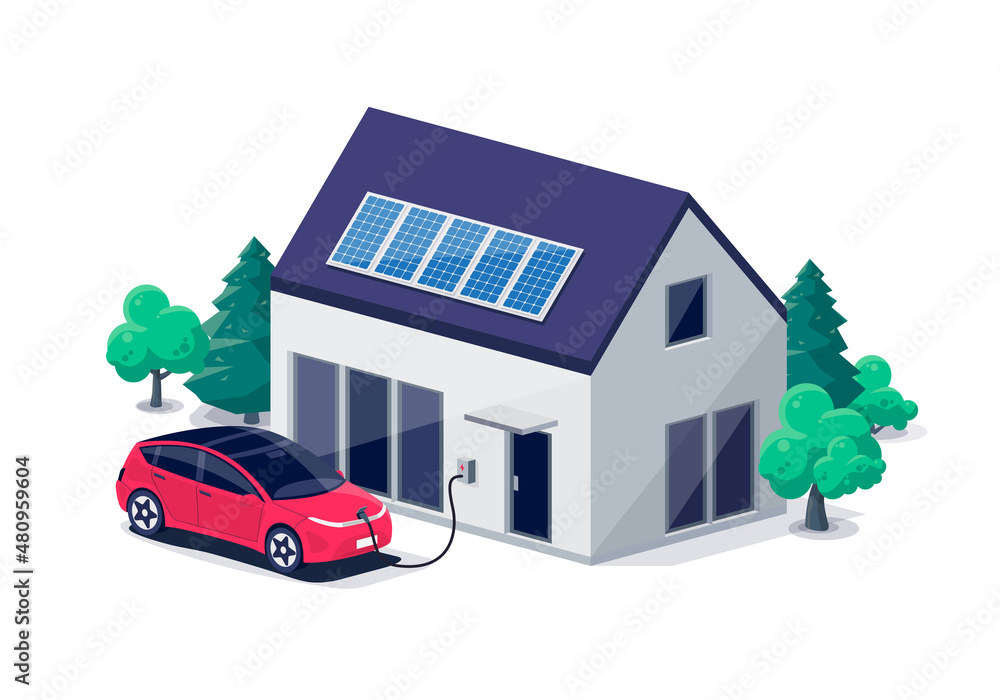
With solar divert (Emporia Pro + Vue, assuming 30% of charging from solar):
- 30% from solar (zero grid cost): 1,479 kWh × $0 = $0
- 70% from grid at $0.08 overnight: 3,450 × $0.08 = $276/year
- Annual electricity cost: $276/year
- 5-year electricity cost: $1,380
- 5-year solar + TOU saving vs no smart features: $2,565
The electricity cost insight: The difference between a dumb charger at average grid rate and a smart charger with TOU scheduling plus solar divert is $2,565 over 5 years in the US. This exceeds the purchase price difference between any two home EV chargers on the market. Electricity cost optimisation is the most financially significant variable in the entire 5-year true cost calculation.
UK Electricity Cost Calculation
Typical UK EV driving:
- Annual mileage: 10,000 miles (16,000 km)
- Average EV efficiency: 3.2 miles/kWh
- Annual kWh consumed for driving: 10,000 ÷ 3.2 = 3,125 kWh
- Charging efficiency losses: 15%
- kWh drawn from charger annually: 3,125 × 1.15 = 3,594 kWh
Without TOU scheduling (standard UK rate 28p/kWh):
- Annual electricity cost: 3,594 × £0.28 = £1,006/year
- 5-year electricity cost: £5,030
With Octopus Go (7.5p/kWh overnight):
- Annual electricity cost: 3,594 × £0.075 = £270/year
- 5-year electricity cost: £1,349
- 5-year Octopus Go saving: £3,681
With Octopus Go + Myenergi Zappi solar divert (30% from solar):
- 30% from solar: 1,078 kWh × £0 = £0
- 70% from Octopus Go overnight: 2,516 × £0.075 = £189/year
- Annual electricity cost: £189/year
- 5-year electricity cost: £943
- 5-year saving vs standard rate, no smart features: £4,087
The UK electricity cost insight: The difference between charging on standard rate with no smart features and charging on Octopus Go with Zappi solar divert is £4,087 over 5 years. This is by far the most financially significant variable in UK home EV charging — larger than the cost of the charger itself in almost every scenario.
German Electricity Cost Calculation
German context: Germany has among the highest residential electricity rates in Europe — approximately €0.30-€0.40/kWh. This makes electricity cost optimisation even more financially critical than in the UK or US.
Typical German EV driving:
- Annual mileage: 15,000 km
- EV efficiency: 5.5 km/kWh (European metric)
- Annual kWh: 15,000 ÷ 5.5 = 2,727 kWh
- With charging losses: 2,727 × 1.15 = 3,136 kWh
Without TOU scheduling (€0.35/kWh average):
- Annual electricity cost: 3,136 × €0.35 = €1,098/year
- 5-year electricity cost: €5,488
With TOU scheduling (German night tariff €0.20/kWh where available):
- Annual electricity cost: 3,136 × €0.20 = €627/year
- 5-year electricity cost: €3,136
- 5-year saving: €2,352
With solar divert (30% from solar in German climate):
- 5-year electricity cost with solar + TOU: approximately €2,000
- 5-year saving vs standard rate: €3,488
The German insight: Germany’s high electricity rates make smart charging economics even more compelling than in the UK or US. German EV owners who pay standard grid rates without TOU optimisation are leaving the most money on the table of any major European market.
The 5-Year True Cost Model — US Scenarios
Scenario 1: US Budget Setup — Grizzl-E Classic, No Smart Features, Standard Rate
Hardware: Grizzl-E Classic — $229 Installation: Standard installation, no panel upgrade — $500 Permits: $100 Incentives: Federal tax credit (30% of $829 = $249) — applied Net hardware + installation: $829 – $249 = $580
5-year electricity (standard rate $0.16/kWh, 15,000 miles/year): $3,945
Smart feature savings: $0 (no smart features)
Maintenance: Minimal — $50 over 5 years (connector inspection, occasional cleaning)
5-year true cost total: $580 + $3,945 + $50 = $4,575
Scenario 2: US Smart Charger, TOU Scheduling, No Solar
Hardware: ChargePoint Home Flex — $699 Installation: $500 Permits: $100 Incentives: Federal tax credit (30% of $1,299 = $390) + utility rebate (assume $300) — applied Net hardware + installation: $1,299 – $690 = $609
5-year electricity (TOU overnight rate $0.08/kWh): $1,970
Smart feature savings: TOU scheduling already reflected in electricity cost
Maintenance: $75 over 5 years (smart features add minor software support costs)
5-year true cost total: $609 + $1,970 + $75 = $2,654
Saving vs budget setup: $1,921 over 5 years — the smart charger costs $1,921 less despite costing $470 more to buy.
Scenario 3: US Smart Charger, TOU + Solar, 100-Amp Panel
Hardware: Emporia Pro NACS — $399 Vue monitor: $175 Installation: $500 Permits: $100 Incentives: Federal tax credit (30% of $1,174 = $352) + utility rebate $500 (California PG&E) — applied Net hardware + installation: $1,174 – $852 = $322
5-year electricity (TOU + 30% solar): $1,380
Smart feature savings: Load management avoids panel upgrade ($2,000 assumed saving) — reflected as negative cost
Panel upgrade avoided: -$2,000 (this is a cost avoided, reducing true cost of the Emporia Pro setup)
Maintenance: $75 over 5 years
5-year true cost total: $322 + $1,380 + $75 – $2,000 = -$223
The Emporia Pro scenario actually generates positive net value over 5 years in California — between the incentives, solar savings, and avoided panel upgrade, the total 5-year benefit exceeds the total 5-year cost.
Scenario 4: US Premium Setup, Tesla Wall Connector, Standard Rate
Hardware: Tesla Wall Connector — $425 Installation: $600 (hardwired only) Permits: $100 Incentives: Federal tax credit (30% of $1,125 = $338) — applied Net hardware + installation: $1,125 – $338 = $787
5-year electricity (standard rate, no TOU scheduling): $3,945
Smart feature savings: Minimal (basic scheduling only)
Maintenance: $50 over 5 years
5-year true cost total: $787 + $3,945 + $50 = $4,782
The Tesla Wall Connector scenario without TOU scheduling costs $2,128 more over 5 years than the ChargePoint Home Flex with TOU scheduling — despite the Tesla hardware being $276 cheaper. The electricity rate choice matters far more than the hardware choice.
US 5-Year True Cost Summary
| Setup | Net Hardware + Install | 5-Year Electricity | Smart Savings | 5-Year Total |
|---|---|---|---|---|
| Budget (Grizzl-E, no TOU) | $580 | $3,945 | $0 | $4,575 |
| Smart, TOU (ChargePoint) | $609 | $1,970 | Reflected | $2,654 |
| Smart, TOU + Solar (Emporia, CA) | $322 | $1,380 | +$2,000 avoided | -$223 |
| Premium, no TOU (Tesla WC) | $787 | $3,945 | $0 | $4,782 |
| Smart, solar only, no TOU | $480 | $2,500 | Partial | $3,030 |
The 5-Year True Cost Model — UK Scenarios
Scenario 1: UK Budget Setup — Rolec WallPod, Standard Rate, No Solar
Hardware: Rolec WallPod — £499 Installation: £300 OZEV grant (flat owner): -£350 Net hardware + installation: £449
5-year electricity (standard rate 28p/kWh): £5,030
Smart feature savings: Basic scheduling only — minor saving
Maintenance: £75 over 5 years
5-year true cost total: £449 + £5,030 + £75 = £5,554
Scenario 2: UK Smart Charger, Octopus Go, No Solar
Hardware: Wallbox Pulsar Plus — £749 Installation: £350 OZEV grant (flat owner): -£350 Net hardware + installation: £749
5-year electricity (Octopus Go 7.5p/kWh): £1,349
Smart feature savings: Tariff saving already reflected in electricity cost
Maintenance: £75 over 5 years
5-year true cost total: £749 + £1,349 + £75 = £2,173
Saving vs budget setup: £3,381 over 5 years. The Wallbox Pulsar Plus at standard rate would cost more. The Octopus Go tariff generates the saving — the charger just enables it.
Scenario 3: UK Smart Charger, Octopus Go + Solar Divert, Myenergi Zappi
Hardware: Myenergi Zappi — £799 Installation: £400 (includes CT clamp) OZEV grant (flat owner): -£350 Net hardware + installation: £849
5-year electricity (Octopus Go + 30% solar): £943
Smart feature savings: Solar divert additional saving already in electricity cost
Maintenance: £75 over 5 years
5-year true cost total: £849 + £943 + £75 = £1,867
Saving vs budget setup: £3,687 over 5 years. The Myenergi Zappi costs £300 more to buy than the Rolec WallPod and delivers £3,687 more in 5-year savings.
Scenario 4: UK Premium Setup, Andersen A2, No Solar, Standard Rate
Hardware: Andersen A2 — £1,499 Installation: £500 (complex, Andersen-approved installer) OZEV grant: -£350 Net hardware + installation: £1,649
5-year electricity (standard rate 28p/kWh — no smart tariff integration): £5,030
Smart feature savings: OCPP 2.0.1 — minimal current value
Maintenance: £100 over 5 years (premium hardware, occasional service)
5-year true cost total: £1,649 + £5,030 + £100 = £6,779
The Andersen A2 without smart tariff optimisation is the most expensive 5-year scenario — premium hardware cost plus standard electricity rates creates the worst total cost outcome. Beautiful charger. Poor 5-year economics without tariff optimisation.
UK 5-Year True Cost Summary
| Setup | Net Hardware + Install | 5-Year Electricity | 5-Year Total |
|---|---|---|---|
| Budget (Rolec, standard rate) | £449 | £5,030 | £5,554 |
| Smart, Octopus Go (Wallbox) | £749 | £1,349 | £2,173 |
| Smart, Octopus Go + Solar (Zappi) | £849 | £943 | £1,867 |
| Premium, standard rate (Andersen) | £1,649 | £5,030 | £6,779 |
| Smart, Octopus Agile + Solar (Zappi) | £849 | £700 | £1,624 |
The 5-Year True Cost Model — European Scenarios
France — ADVENIR + TVA Reduction + Solar
Hardware: Easee One — €549 Installation: €400 ADVENIR subsidy: -€600 (individual apartment) TVA reduction saving: -€155 (14.5% on €1,069 net) Net hardware + installation: €194
5-year electricity (French off-peak rate €0.15/kWh): €2,354
Smart feature savings: Scheduled off-peak charging reflected in electricity cost
Maintenance: €75 over 5 years
5-year true cost total: €194 + €2,354 + €75 = €2,623
The ADVENIR subsidy and TVA reduction transform France into one of the cheapest markets for home EV charging net installation cost in Europe.
Netherlands — SEEH + Smart Tariff
Hardware: Easee One — €549 Installation: €400 SEEH subsidy (30% of €949): -€285 Net hardware + installation: €664
5-year electricity (Dutch off-peak €0.18/kWh): €2,822
Maintenance: €75 over 5 years
5-year true cost total: €664 + €2,822 + €75 = €3,561
Germany — No Direct Grant, High Electricity Rate
Hardware: Wallbox Pulsar Plus — €749 Installation: €500 KfW financing saving: Approximately €150 in interest reduction over 5 years Net hardware + installation: €1,099
5-year electricity (German night tariff €0.20/kWh): €3,136
Maintenance: €75 over 5 years
5-year true cost total: €1,099 + €3,136 + €75 = €4,310
Germany’s high electricity rates and absence of a direct grant programme create the highest 5-year true cost among the European markets modelled — reinforcing the importance of smart tariff optimisation in the German market.
Italy — Bonus Colonnine + Low Electricity Rate
Hardware: Wallbox Pulsar Plus — €749 Installation: €400 Bonus Colonnine (80% up to €1,500): -€919 Net hardware + installation: €230
5-year electricity (Italian rate €0.22/kWh): €3,450
Maintenance: €75 over 5 years
5-year true cost total: €230 + €3,450 + €75 = €3,755
Italy’s Bonus Colonnine creates one of the lowest net installation costs in Europe — but the absence of established smart tariff products means ongoing electricity optimisation is less accessible than in the UK.
European 5-Year True Cost Summary
| Market/Setup | Net Install | 5-Year Electricity | 5-Year Total |
|---|---|---|---|
| France (ADVENIR + smart) | €194 | €2,354 | €2,623 |
| Netherlands (SEEH + smart) | €664 | €2,822 | €3,561 |
| Italy (Bonus Colonnine) | €230 | €3,450 | €3,755 |
| Germany (smart tariff) | €1,099 | €3,136 | €4,310 |
| Norway (Enova + smart) | €640 | €2,200 | €2,990 |
| Spain (MOVES III + smart) | €350 | €2,800 | €3,225 |
The Public Charging Comparison — What You Pay If Home Charging Is Inadequate
This is the component most 5-year cost analyses completely omit — the cost of relying more heavily on public charging when home charging is absent or inadequate.
The Cost of Inadequate Home Charging
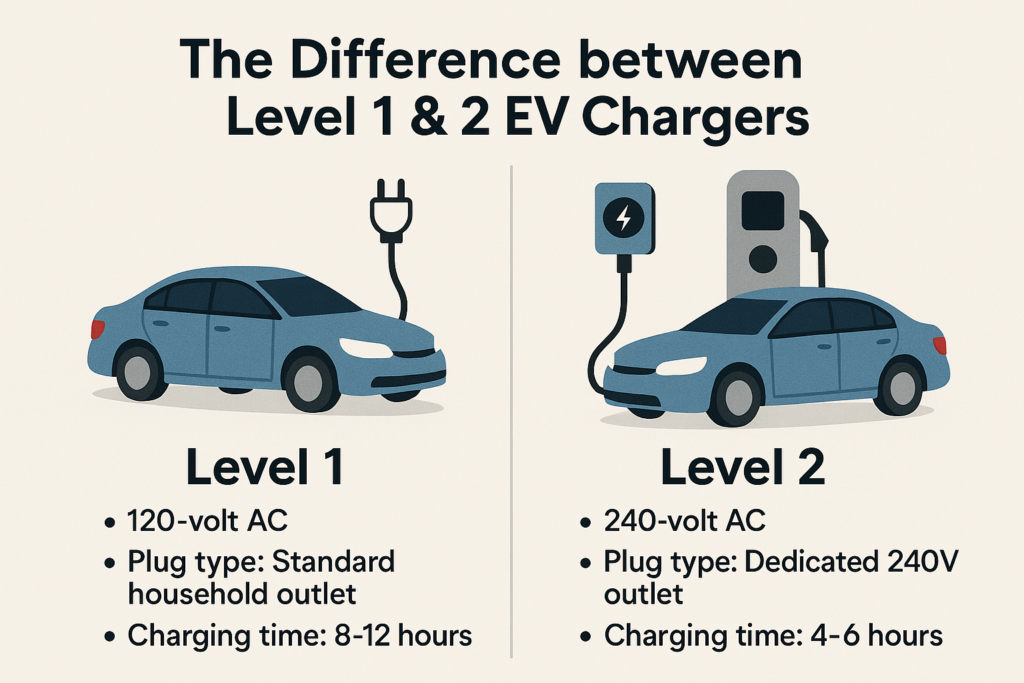
A buyer who installs Level 1 (standard household outlet, 1.4 kW) rather than Level 2 can only add 10-15 km of range per hour of charging. For a driver covering 80 km daily who arrives home with 20% battery, overnight Level 1 charging adds approximately 100-120 km — sufficient for typical daily use but with less buffer than Level 2 provides.
When Level 1 is insufficient — weekend trips, days with higher mileage, cold weather reducing range — the driver needs public charging. DC fast charging at Electrify America, Tesla Supercharger, or ChargePoint DC stations runs $0.45-$0.55/kWh in the US, or £0.75-£0.90/kWh at Ionity in Europe.
US public charging cost premium:
- 20 public DC fast charging sessions annually at 15 kWh per session: 300 kWh
- At $0.50/kWh: $150/year additional cost vs home charging
- Over 5 years: $750
UK public charging cost premium:
- 20 public DC fast charging sessions annually at 15 kWh per session: 300 kWh
- At £0.80/kWh: £240/year additional cost vs home charging
- Over 5 years: £1,200
For buyers who genuinely rely on public charging as a supplement to inadequate home charging, these additional costs should be factored into the 5-year true cost of the home charging setup that necessitated the public charging dependency.
The Maintenance Reality — What Home EV Chargers Actually Cost to Maintain
Compared to petrol car maintenance, home EV charger maintenance is genuinely minimal. But it’s not zero and some scenarios create maintenance costs worth factoring in.
Typical 5-Year Maintenance Costs
Hardware maintenance (all chargers):
- Connector inspection and cleaning: £10-£20 annually (minimal cost, DIY)
- Cable inspection for wear: Visual, no cost
- Mounting hardware check: Annual, no cost
Smart charger software maintenance:
- App updates: Free (automated)
- WiFi module issues (occasional): $0-$50 for troubleshooting support
- Firmware update failure requiring reset: Rare, typically resolved via manufacturer support at no cost
Warranty claims: If hardware fails within warranty, repair or replacement is covered. Beyond warranty (year 4-5 for 3-year warranty chargers), out-of-warranty repairs for smart charger electronics can cost $100-$300.
Estimated 5-year maintenance costs:
- Basic dumb charger (Grizzl-E Classic): $30-$50
- Smart charger with app (ChargePoint, Emporia, Wallbox): $50-$100
- Premium charger (Andersen A2, ABB Terra): $75-$150
Maintenance is genuinely a minor component of 5-year true cost — it’s worth including for completeness but doesn’t change the fundamental economics.
The Five Decisions That Most Affect 5-Year True Cost
The 5-year true cost of home EV charger ownership 2026 US vs Europe comparison analysis reveals that five decisions dominate the total:
Decision 1: Smart Tariff Adoption (Highest Impact)
Switching to a smart TOU tariff — Octopus Go in the UK, an overnight TOU tariff in the US — reduces 5-year electricity cost by $1,975-£3,681 depending on market and mileage. This single decision has more financial impact than every other decision in the list combined for most buyers.
Action: Switch to the best available smart EV tariff in your area before or simultaneously with installing your charger. Don’t install a dumb charger on a standard tariff when smart options are available.
Decision 2: Incentive Claiming (Second Highest Impact)
Claiming all available incentives — OZEV grant (UK), federal tax credit (US), utility rebate (US), ADVENIR/SEEH/Bonus Colonnine (Europe) — reduces net installation cost by £350-$1,860 depending on market and specific programme availability. Missing any applicable incentive is the most avoidable cost in the entire 5-year analysis.
Action: Research every applicable incentive before purchasing. Apply before installation where required. Choose hardware from approved lists.
Decision 3: Solar Divert Capability (Third Highest Impact for Solar Owners)
For buyers with solar panels, a solar-integrated smart charger (Emporia Pro in the US, Myenergi Zappi in the UK) reduces 5-year electricity costs by an additional $565-£406 beyond TOU scheduling alone. Over 7-10 years the saving compounds further.
Action: If you have solar or plan to install it within 2 years, specify solar divert capability in your charger selection. The premium pays back within 1-2 years.
Decision 4: Load Management vs Panel Upgrade (Potential Highest Impact for 100-Amp Panel US Owners)
For US homeowners on 100-amp panels, load management through the Emporia Pro + Vue avoids a $1,500-$4,000 panel upgrade. This is the highest single-transaction saving in the entire 5-year analysis for this specific scenario.
Action: Before assuming a panel upgrade is necessary, get an Emporia Pro + Vue and assess whether load management makes 48A charging viable. The $549-$599 load management solution is dramatically cheaper than the panel upgrade in most cases.
Decision 5: Hardware Brand Reliability (Long-Term Impact)
A charger from a brand that ceases operations, stops supporting its app, or has high hardware failure rates creates costs and inconveniences beyond the purchase price. The most reliable established brands — Tesla, ChargePoint, Wallbox, Myenergi — have lower long-term reliability risk than newer or smaller brands.
Action: Buy from established brands with genuine service infrastructure. The $100-$200 premium over the cheapest alternative is insured against out-of-warranty failure and software abandonment risk.
The Honest 5-Year True Cost Rankings — Best to Worst Value
Based on the modelling above, here’s the honest 5-year true cost ranking by scenario:
Best 5-Year Value — All Markets
1. California (US): Emporia Pro + Vue + TOU + Solar + Incentives 5-year true cost: Net negative (generates positive value) Why: Federal credit + utility rebate + avoided panel upgrade + solar savings + TOU savings
2. UK: Myenergi Zappi + Octopus Agile + Solar 5-year true cost: £1,624 Why: OZEV grant + solar divert + Agile dynamic pricing creates the best electricity economics in any market
3. France: Easee One + ADVENIR + TOU + Solar 5-year true cost: €2,200 (estimated with solar divert) Why: ADVENIR + TVA reduction creates near-zero installation cost, solar divert reduces ongoing electricity costs significantly
4. UK: Wallbox Pulsar Plus + Octopus Go 5-year true cost: £2,173 Why: OZEV grant + Octopus Go rate creates excellent electricity economics without solar
5. Norway: Any smart charger + Enova + TOU 5-year true cost: approximately €2,990 Why: Enova grant + relatively low Norwegian electricity rates + smart scheduling
Worst 5-Year Value — All Markets
1. UK: Andersen A2 + Standard Rate + No Solar 5-year true cost: £6,779 Why: Premium hardware + standard electricity rate creates the worst combination. Beautiful charger, terrible economics.
2. US: Tesla Wall Connector + Standard Rate + No TOU 5-year true cost: $4,782 Why: Premium hardware without tariff optimisation. The Wall Connector is the right buy for Tesla households — but only with TOU scheduling enabled.
3. Germany: Any charger + Standard Rate 5-year true cost: €4,300-€5,500 Why: High German electricity rates without TOU optimisation create the highest ongoing electricity costs in the EU.
The consistent insight: Electricity tariff choice and smart feature utilisation matter far more to 5-year true cost than hardware choice. The most expensive hardware on the best tariff often costs less over 5 years than budget hardware on a standard rate.
The Spreadsheet You Should Build Before Buying
This section gives you the framework to calculate your own 5-year true cost based on your specific situation:
Step 1: Calculate your annual kWh Annual miles (or km ÷ 1.6) ÷ your EV’s miles/kWh efficiency × 1.15 (charging losses)
Step 2: Calculate 5-year electricity cost at current rate Annual kWh × current electricity rate × 5
Step 3: Calculate 5-year electricity cost at best available rate Annual kWh × best available EV tariff rate × 5 (for % from solar, multiply solar portion by £0 or $0)
Step 4: Calculate net hardware + installation cost Hardware price + installation quote – all applicable incentives (federal credit, state/utility rebate, OZEV, ADVENIR, etc.)
Step 5: Add avoided costs Panel upgrade avoided (if relevant): subtract $1,500-$4,000
Step 6: Add maintenance estimate $50-$100 for smart chargers over 5 years
Step 7: Calculate total Net hardware + installation + 5-year electricity at best rate + maintenance – avoided costs = 5-year true cost
Step 8: Compare scenarios Run the calculation for 2-3 charger options. The differences will likely surprise you.
Internal Links — Further Reading on Clean Energy Bazaar
The 5-year true cost of home EV charger ownership 2026 US vs Europe comparison is the financial analysis that ties together every practical guide on this site.
For the US state rebates that reduce net installation cost — the second most impactful variable in the 5-year model — our US EV charger rebates by state 2026 guide covers every major programme. For European grants that similarly reduce net costs, our EV home charging incentives Europe 2026 guide covers every country. For the smart features that reduce 5-year electricity costs — the single largest variable — our smart EV chargers 2026 features worth the cost guide gives specific payback timelines. For the best US home charger options across every scenario in this guide, our best home EV chargers 2026 US comparison covers ten options honestly. For UK and European hardware options, our best Level 2 EV chargers UK Europe 2026 guide covers every major option. For the installation cost component specifically, our professional EV charger installation costs 2026 guide covers every market honestly. And for the load management decision that determines whether a panel upgrade is necessary, our load balancing EV chargers 2026 guide covers the full picture.
Final Thoughts
The 5-year true cost of home EV charger ownership 2026 US vs Europe comparison reveals a consistent and counterintuitive truth: the hardware you choose is the least important financial decision in home EV charging. The tariff you’re on and the smart features that help you optimise it matter far more.
A £249 Rolec WallPod on standard UK electricity rates costs £5,554 over 5 years. A £799 Myenergi Zappi on Octopus Agile with solar costs £1,624 over 5 years. The £550 more expensive charger costs £3,930 less over 5 years.
That’s the 5-year true cost of home EV charger ownership 2026 US vs Europe comparison in one sentence. And it’s the insight that most buyers are missing when they compare charger prices without accounting for the electricity costs that dominate the 5-year picture.
The actions that matter most:
- Switch to the best available smart EV tariff before or when you install your charger
- Claim every applicable incentive — research before purchase, not after
- Choose solar divert capability if you have or plan solar — it pays back within 2 years
- Choose load management over a panel upgrade if you’re on a 100-amp US panel
- Buy from established brands — the £100-$200 reliability premium is cheap insurance against 5-year ownership risk
Do those five things and the hardware choice matters much less than the comparison guides suggest.