The global energy landscape changed abruptly in early 2026. Conflict in the Middle East, including the disruption of the Strait of Hormuz — a key artery for global oil shipments — sent oil prices soaring. Brent crude climbed from an average of $68 per barrel in 2025 to approximately $100 per barrel in April 2026. Pump prices surged above €2.0 per litre across Europe. Road transport, which accounts for close to half of global oil demand, was hit first and hardest.
For the millions of drivers who rely on petrol and diesel, the impact was immediate. For EV owners, the story was very different.
According to the International Energy Agency’s Global EV Outlook 2026, the annual fuel cost savings associated with driving an EV in the European Union grew 35% compared to 2025 savings. An average EU driver with intensive vehicle use can now save up to $2,800 per year in fuel costs by switching from a petrol car to an electric one — approximately $700 more than in 2025. For corporate fleets that travel long distances, the running cost savings can be several times larger.
This guide on EV vs. ICE: 5-year cost of ownership post-Middle-East oil price spikes provides the complete, honest analysis. It covers the IEA data on fuel cost savings, the 5-year total cost of ownership comparison across major markets, the regional differences, the hidden costs that can erode savings, and what this all means for today’s buyers.
The Oil Price Shock: What Actually Happened
From $68 to $100 a Barrel in Months
The geopolitical trigger:
The escalation of the Middle East conflict, particularly the disruption to the Strait of Hormuz, reignited volatility in global energy markets. The strait is a critical chokepoint for global oil shipments, and its restriction sent shockwaves through energy markets. Brent crude surged from an average of $68 per barrel in 2025 to approximately $100 per barrel by April 2026. Some estimates placed the spike as high as $113 per barrel.
The impact on pump prices:
The oil price spike translated directly into higher fuel costs at the pump. Across Europe, petrol prices rose above €2.0 per litre. In the United States, the impact was equally severe. iSeeCars data shows that the annual fuel cost for an internal combustion engine vehicle rose from $1,533 in January 2026 to $2,240 in April 2026 — an increase of $706 in just three months.
The EV insulation:
While petrol drivers faced a $706 increase in annual fuel costs, EV drivers saw their annual charging costs rise by just $11 during the same period. The crisis premium added roughly $44 per month to petrol costs but only $8 to EV running costs — leaving traditional drivers five times more exposed to market fluctuations.
The IEA’s assessment:
The IEA noted that the current high oil price environment is drawing consumer attention to the economic benefits of driving EVs. Electric cars generally have lower running costs than internal combustion engine vehicles, mainly due to their higher efficiency. The recent rise in oil prices has further increased the cost savings associated with driving an EV.
The 35% Fuel Savings Increase: What the IEA Data Shows
How Much More EV Drivers Are Saving
The headline figure:
Based on average oil prices in April 2026, the annual fuel cost savings associated with driving an EV in the European Union grew 35% compared to 2025 savings. This is not a marginal improvement — it is a step change in the economic case for electric vehicles.
The dollar figure:
In real terms, an average EU driver with intensive vehicle use can save up to $2,800 per year in fuel costs by switching from a petrol car to an electric one. That is approximately $700 more per year than in 2025. Over five years, that represents an additional $3,500 in savings compared to the pre-oil-shock environment.
The fleet advantage:
For corporate fleets that travel long distances, the running cost savings can be several times larger than for the general consumer. Fleet managers are already making these calculations, and orders for electric vehicles in the B2B segment are responding accordingly.
The home charging premium:
The IEA report also highlights a critical nuance: the savings are significantly larger when the EV is charged at home. Charging exclusively at public fast-charging points can cost up to 240% more than residential electricity rates, which would eliminate virtually all the operating savings versus fuel. Approximately 75% of EV owners’ charging sessions occur at home or at work, meaning the majority are capturing the full economic differential. However, for those without access to home charging — a problem particularly relevant in dense urban areas and rental housing — the economic argument weakens substantially.
The 5-Year Total Cost of Ownership: EV vs. ICE
The Full Financial Picture
The operating cost gap:
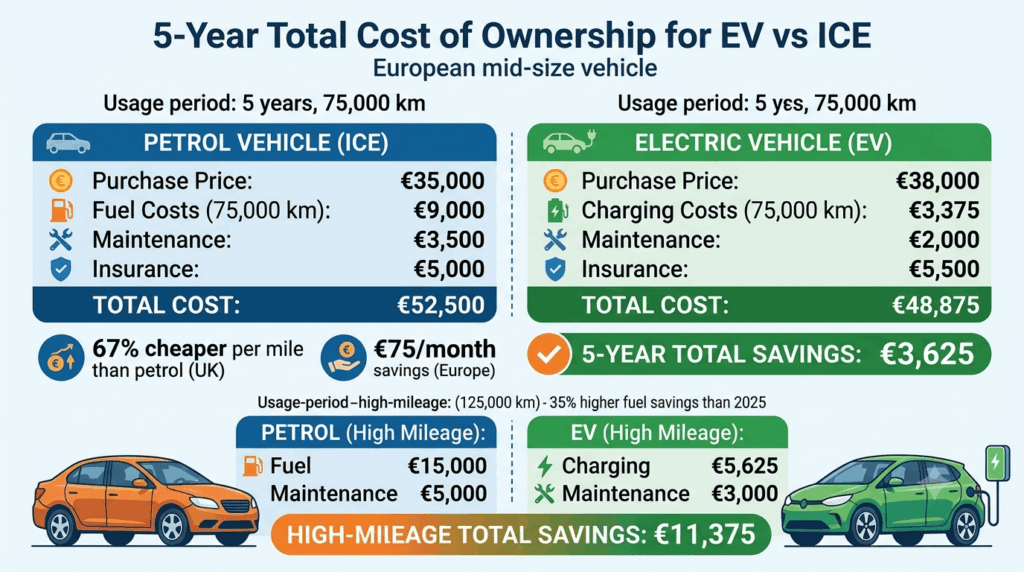
The operating cost gap between EVs and ICE vehicles has widened dramatically since the oil price spike. In Europe, driving a petrol car is expected to cost around €140 ($162) per month, compared to €65 ($76) for an EV — a monthly saving of €75 ($86) for EV drivers.
In the UK, the AA found that EVs charged at home are now 67% cheaper per mile than petrol equivalents, up from 57% cheaper in the first quarter of 2026. That equates to a conservative saving of at least £20 for every 200 miles driven.
The 5-year projection:
Over a 5-year ownership period covering typical mileage (approximately 75,000 to 100,000 kilometres), the cumulative savings are substantial.
For a European driver covering 15,000 kilometres per year:
- Annual fuel cost (petrol): Approximately €1,680 ($1,944) at current prices
- Annual charging cost (home): Approximately €780 ($900)
- Annual saving: Approximately €900 ($1,044)
- 5-year saving: Approximately €4,500 ($5,220)
For a high-mileage driver covering 25,000 kilometres per year:
- Annual fuel cost (petrol): Approximately €2,800 ($3,240)
- Annual charging cost (home): Approximately €1,300 ($1,500)
- Annual saving: Approximately €1,500 ($1,740)
- 5-year saving: Approximately €7,500 ($8,700)
The maintenance savings:
EVs also offer significant maintenance savings over ICE vehicles. EVs have fewer moving parts, no oil changes, no timing belts, no exhaust systems, and regenerative braking that extends brake pad life. Typical maintenance savings range from 30-40% lower over the life of the vehicle. Over five years, this can add an additional $2,000 to $3,000 in savings.
The depreciation factor:
The one area where EVs can underperform ICE vehicles is depreciation. As noted in some markets, heavy depreciation can offset some of the operating cost advantages. However, the rapid growth in EV adoption and improving battery longevity are gradually stabilising used EV values. In the current environment of high oil prices, used EV demand is surging.
Regional Breakdown: How the Cost Comparison Varies
Europe: The Biggest Savings
Europe has seen the largest increase in fuel cost savings due to the combination of high oil prices and relatively stable electricity costs. The 35% increase in annual fuel cost savings documented by the IEA is specific to the EU.
At current oil price levels, EV drivers in Europe are enjoying fuel cost savings that are 35% higher compared to just a year ago. For a driver who was saving €2,000 per year in 2025, that figure has now increased to approximately €2,700 per year.
Germany, Spain, and Italy — the countries that led Europe’s 30% EV sales surge in 2025 — are now seeing even stronger economic incentives for EV adoption.
United States: A Mixed Picture
In the United States, the picture is more complex. While the oil price spike has increased the cost of petrol, the absence of federal EV purchase incentives has created a different economic equation.
The iSeeCars data shows that petrol-only vehicles saw their annual fuel costs rise from $1,533 in January 2026 to $2,240 in April 2026 — an increase of $706. EVs saw their annual charging costs rise by just $11 during the same period.
However, the higher upfront cost of EVs in the US — combined with the loss of the $7,500 federal tax credit — means that the payback period for the EV premium is longer than in Europe. For high-mileage drivers, the operating cost savings can still justify the premium. For low-mileage drivers, the math is less compelling.
Emerging Markets: The Affordability Catalyst
In emerging markets, the oil price spike has been a powerful catalyst for EV adoption. In Southeast Asia, annual EV sales more than doubled in 2025 to reach a sales share of nearly 20%. Vietnam, the largest EV market in the region, has already announced plans to expand or extend EV tax incentives as part of its response to the current energy crisis.
In Latin America, EV sales grew by 75% in 2025, led by Brazil and Mexico. The combination of high oil prices and affordable Chinese EV imports has made the economic case for EVs compelling in these markets.
The Hidden Costs: What Can Erode the Savings
The Public Charging Penalty
The IEA report highlights a critical warning: charging exclusively at public fast-charging points can cost up to 240% more than residential electricity rates, which would eliminate virtually all the operating savings versus fuel.
For drivers without access to home charging — particularly those in dense urban areas and rental housing — the economic argument for EVs weakens substantially. In some markets, public charging costs have risen to the point where the per-kilometre cost of an EV can match or exceed that of a fuel-efficient petrol car.
The solution: For buyers without home charging, it is essential to calculate the local public charging costs before making a purchase decision. Time-of-use rates, subscription plans, and workplace charging can all help reduce the public charging penalty.
The EV Price Premium
Despite declining battery costs, EVs still carry a price premium over comparable ICE vehicles. In the US, the average EV transaction price was $55,300 in February 2026 — approximately $6,500 more than the average gas vehicle. This premium must be amortised over the ownership period.
However, the gap is narrowing. Global average EV battery prices declined by 8% in 2025, and the availability of more affordable models is expanding. In Europe, the share of electric models sold below the average price tag of their petrol equivalents rose above 30% in 2025.
The Insurance Factor
EV insurance costs can be higher than for ICE vehicles due to the higher cost of repair and replacement parts. This is particularly true for vehicles with large battery packs and advanced technology. Buyers should factor insurance costs into their total cost of ownership calculation.
The 5-Year Math: Putting It All Together
A Real-World Example
To illustrate the 5-year cost difference, consider a European buyer comparing a mid-size EV and a comparable petrol vehicle over a 5-year, 75,000-kilometre ownership period.
Petrol Vehicle:
- Purchase price: €35,000
- Fuel (75,000 km at 6L/100km, €2.00/L): €9,000
- Maintenance (5 years): €3,500
- Insurance (5 years): €5,000
- Total 5-year cost: €52,500
Electric Vehicle:
- Purchase price: €38,000
- Charging (75,000 km at 18kWh/100km, €0.25/kWh home): €3,375
- Maintenance (5 years): €2,000
- Insurance (5 years): €5,500
- Total 5-year cost: €48,875
5-year savings with EV: €3,625 (approximately 7%)
For a high-mileage driver covering 125,000 kilometres over 5 years, the savings increase substantially:
Petrol Vehicle:
- Fuel (125,000 km): €15,000
- Maintenance: €5,000
- Total fuel+maintenance: €20,000
Electric Vehicle:
- Charging (125,000 km): €5,625
- Maintenance: €3,000
- Total charging+maintenance: €8,625
5-year savings: €11,375
The Verdict
For average-mileage drivers, the 5-year total cost of ownership of an EV is now competitive with or better than an ICE vehicle in most European markets. For high-mileage drivers, the EV advantage is overwhelming. The oil price spike has tipped the scales further in favour of electric vehicles.
What This Means for Today’s Buyers
The Practical Implications
If you are a high-mileage driver: The economic case for an EV has never been stronger. The combination of high oil prices and low electricity costs means you can save thousands of euros per year in fuel costs. Over five years, the savings can exceed €10,000.
If you are a low-mileage driver: The math is less compelling, but still positive in most cases. The higher upfront cost of the EV may take longer to recover, but the operating cost savings will eventually justify the premium.
If you lack home charging: You need to do the math carefully. Public charging costs can erase much of the fuel savings. Look for workplace charging, subscription plans, or time-of-use rates that can reduce your charging costs.
The charger credit deadline: In the US, the federal charger tax credit (30% up to $1,000) expires on June 30, 2026. If you are buying an EV and installing a home charger, act before this deadline.
Internal Links: Further Reading on Clean Energy Bazaar
The EV vs. ICE: 5-year cost of ownership post-Middle-East oil price spikes guide connects to the EV market and policy guides on cleanenergybazaar.com.
For the IEA Global EV Outlook 2026 summary covering the full global picture, our IEA Global EV Outlook 2026: 2025 sales hit 20M, capturing 25% of global car sales guide covers the flagship report in full. For the Europe’s EV sales surge guide covering the market context, our Europe’s EV sales surge 30% – how Germany, Spain, and Italy are leading the comeback guide covers the regional EV adoption surge. For the 2026 EV buyer’s guide covering state incentives, our 2026 EV buyer’s guide: a state-by-state incentive checklist for the US guide covers the incentive landscape. For the US EV sales slump guide covering the US market context, our US EV sales slump 25% – policy uncertainty and the hybrid pivot guide covers the US EV market conditions.
Final Thoughts
EV vs. ICE: 5-year cost of ownership post-Middle-East oil price spikes — and the honest answer is that the math has fundamentally changed.
The oil price spike that began in early 2026 has tipped the economic scales in favour of electric vehicles. The IEA’s data is clear: annual fuel cost savings for EV drivers in the EU grew 35% compared to 2025 savings. An average driver can now save up to $2,800 per year in fuel costs. Over five years, that adds up to approximately $14,000 in fuel savings alone.
When maintenance savings and the relative stability of electricity prices are factored in, the total cost of ownership advantage for EVs has never been greater. In Europe, driving a petrol car costs around €140 per month compared to €65 for an EV. In the UK, EVs charged at home are 67% cheaper per mile than petrol equivalents.
But the savings are not automatic. They depend on access to home charging, driving patterns, and local electricity and fuel prices. For high-mileage drivers and those with home charging, the savings are substantial. For low-mileage drivers and those reliant on public charging, the case is weaker.
The honest verdict: the oil price spike has made the 5-year cost of ownership equation for EVs more compelling than ever. For many buyers, the economic case for an EV is now overwhelming. But as always, the devil is in the details. Do the math for your specific situation before you buy.